
Choosing the wrong business intelligence tools hurts your bottom line. It isn’t just about software fees. It’s about losing your edge. Smart leaders use data driven reporting to stay ahead of competitors.
Analysts expect the market for data driven reporting to hit $168.06 billion by 2035. Most companies now choose between Power BI, Tableau, or Looker. These data visualization platforms help you make decisions five times faster.
They turn raw numbers into clear answers. You need a tool that fits your workflow. This guide compares the top options to help you pick a winner.
Selecting the right business intelligence tools involves more than just comparing price tags. You need a platform that connects your team to the facts. These data visualization platforms lead the market in 2026 by offering unique ways to handle data driven reporting.
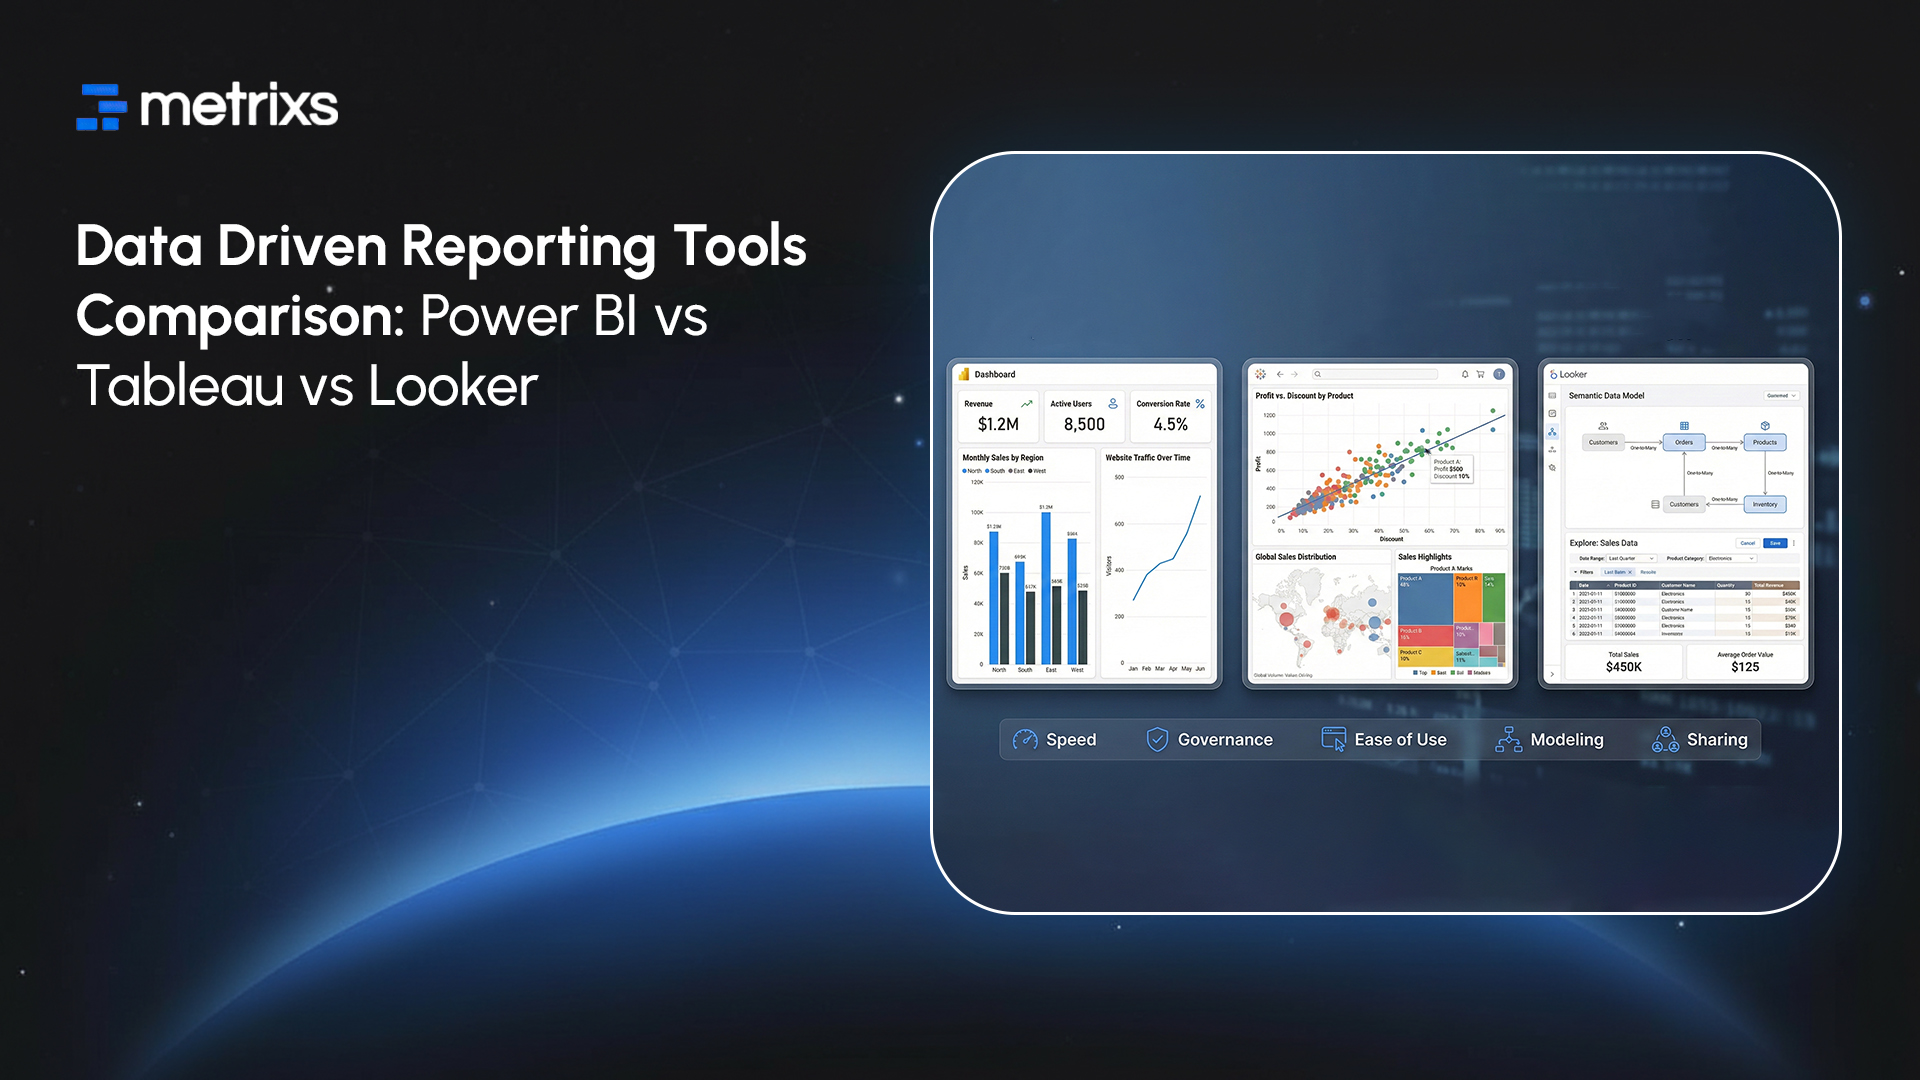
Power BI vs Tableau vs Looker: Comprehensive Feature Comparison
1. Power BI – Microsoft Ecosystem Champion
Power BI is a powerhouse for data driven reporting within the Microsoft ecosystem. It turns messy numbers into interactive visualizations using a familiar interface. In 2026, its AI-powered analytics software helps you find real-time insights without needing a data science degree.
Core Strengths:
- Deep data integration with Excel, Teams, and Azure.
- Advanced self-service BI features through Copilot AI.
- Reliable reporting dashboards that update monthly or instantly.
Pricing: Starts at $14 per user monthly for Pro. Premium costs $24 per user monthly.
Best For: Small to mid-sized teams using Microsoft 365 who need affordable cloud analytics.
Reviews: ⭐⭐⭐⭐⭐ (4.5/5 stars)
2. Tableau – Visualization Powerhouse
Tableau leads among data visualization platforms because it creates deep interactive visualizations. This analytics software provides real-time insights for your data driven reporting. It outpaces other business intelligence tools when your team needs data driven reporting to explore complex information quickly and accurately.
Core Strengths:
- Flexible design for any reporting dashboards.
- Fast data integration for diverse sources.
- Advanced self-service BI for power users.
Pricing: Creator licenses are $75 monthly. Explorer costs $42 and Viewers pay $15.
Best For: Power analysts who need top-tier cloud analytics and visual storytelling.
Reviews: ⭐⭐⭐⭐⭐ (4.7/5 stars)
3. Looker – Data Governance Leader
Looker stands out among business intelligence tools by focusing on a single source of truth. It uses a unique modeling layer to keep your data driven reporting consistent. This platform connects directly to your database, providing real-time insights for every department.
Core Strengths:
- Powerful LookML layer for centralized data integration.
- Seamless connection with Google BigQuery and other cloud analytics.
- Robust self-service BI that ensures everyone uses the same metrics.
Pricing: Custom enterprise pricing often starts around $3,000 per month. Looker Studio Pro offers a cheaper entry point at $9 per user monthly.
Best For: Large enterprises and Google Cloud users who prioritize data accuracy and governed reporting dashboards.
Reviews: ⭐⭐⭐⭐ (4.4/5 stars)
4. Metrixs – High-Accuracy Decision-Making (Bonus)
Metrixs is a specialized analytics software designed for Microsoft Dynamics 365 Finance and Operations. It delivers high-accuracy data driven reporting by consolidating ERP numbers into a unified view. It replaces manual work with real-time insights that help businesses scale their operations with total precision.
Core Strengths:
- Seamless data integration for global financial and inventory oversight.
- Library of 100+ pre-built reporting dashboards for rapid deployment.
- On-demand snapshots that improve data driven reporting accuracy by 99.9%.
Pricing: Custom enterprise plans starting at competitive rates for high-volume ERP environments.
Best For: Large enterprises using Dynamics 365 F&O that need to automate complex data driven reporting.
Reviews: ⭐⭐⭐⭐⭐ (4.9/5 stars)
Business Intelligence Tools for Data Driven Reporting: A Quick Comparison

Use Case Analysis: When Each Business Intelligence Tool Excels
You must match your goals to the right business intelligence tools. Every department needs a different approach for its data driven reporting. Here is how to decide which path fits your team.
1. Power BI for Microsoft-Centric Organizations
Teams using Office 365 find Power BI very easy to adopt. It allows your staff to use self-service BI to turn spreadsheets into live reporting dashboards. This analytics software gives you real-time insights without breaking your budget. It remains a top choice for cloud analytics among small businesses that need simple data integration.
2. Tableau for Visual Storytelling and Advanced Analytics
If you need interactive visualizations, choose Tableau. This tool helps you create a data driven reporting environment where you can explore every detail. Marketing and research teams use Tableau to handle complex data driven reporting tasks that require deep visual depth. It works well with data visualization platforms that require multi-cloud support.
3. Looker for Governed Enterprise Analytics
Large firms use Looker to keep their numbers consistent. This platform ensures your data driven reporting stays accurate across every branch. As one of the leading business intelligence tools, it provides reliable real-time insights for Google Cloud users.
4. Metrixs for Dynamics 365 Finance & Operations
Metrixs is the top choice for companies running Microsoft Dynamics 365. This specialized analytics software solves the problem of slow and manual data driven reporting. It connects directly to your ERP to provide real-time insights into your financial health.
Finding the right balance between these data visualization platforms ensures your company grows with confidence.
Why Metrixs is the Right Data Driven Reporting Choice
Metrixs makes data driven reporting easier by focusing on accuracy and speed. Unlike generic business intelligence tools, we specialize in complex ERP environments.
We help you choose the best data visualization platforms for your specific team needs. Our approach ensures you get real-time insights without the technical headache.
Special Capabilities:
- Rapid Integration: Deploy your data driven reporting setup in under six weeks to minimize business gaps.
- On-Demand Data Snapshots: Capture historical trends and inventory flows for proactive decision-making.
- Centralized Oversight: Use our analytics software to automate financial summaries across global locations effortlessly.
- High-Accuracy Metrics: Access 1,000+ pre-built metrics that ensure 99.9% precision in your reporting dashboards.
Metrixs ensures your data driven reporting strategy actually scales with your business goals.
Conclusion
Many teams struggle with data driven reporting because their software feels too disconnected from their actual work. Common pain points include slow loading times and hard-to-use interfaces that block real-time insights.
If you choose the wrong analytics software, you risk acting on outdated or flat-out wrong numbers. This mistake leads to failed projects and drained budgets. Losing trust in your reporting dashboards is a disaster that allows competitors to pull ahead while you guess your next move.
Metrixs fixes these gaps by streamlining data integration and ensuring your data driven reporting is fast, accurate, and easy to understand.
Contact Metrixs today to see how our business intelligence tools turn your complex data into clear growth strategies.
Frequently Asked Questions
1. Which is cheaper: Power BI, Tableau, or Looker?
Power BI is the most affordable choice for data driven reporting in 2026. It starts at $14, while Tableau and Looker cost much more for cloud analytics. Metrixs help you maximize your ROI across all these business intelligence tools effortlessly.
2. Which tool has the best visualizations: Power BI, Tableau, or Looker?
Tableau leads among data visualization platforms for its interactive visualizations. It offers more design depth than other analytics software. While Power BI handles basic reporting dashboards, Tableau provides the most advanced visual storytelling for your data driven reporting needs.
3. Is Power BI, Tableau, or Looker easier to learn and use?
Power BI is the easiest for self-service BI because it feels like Excel. Tableau has a steeper curve for its interactive visualizations. Looker requires more technical data integration skill, but Metrixs ensures your data driven reporting is simple to manage.
4. Can these tools integrate with my existing data sources?
Yes, these business intelligence tools provide excellent data integration. Power BI connects seamlessly to Microsoft, while Looker excels in cloud analytics. Tableau handles multi-cloud setups well, and Metrixs optimizes real-time insights for your Dynamics 365 data driven reporting.
5. Which tool is best for large enterprises versus small businesses?
Small businesses prefer Power BI for low-cost data driven reporting. Large enterprises use Looker for governed cloud analytics or Tableau for deep research. Metrixs scales for both, providing high-accuracy reporting dashboards and real-time insights for any organization size.
6. How do I know which BI tool is right for my organization?
Evaluate your current analytics software and data integration needs first. If you use Microsoft, Power BI wins. For visual depth, pick Tableau. For governance, choose Looker. Metrixs helps you decide by aligning your data driven reporting with your goals.

