

Analytics maturity splits companies into winners and losers. Most businesses rank their analytics maturity model at a three or lower. This gap hurts your bottom line. Using all types of analytics helps you gain insights 73% faster. It also drives 15% revenue growth.
Experts expect the predictive analytics market to hit $35.45 billion by 2027. Smart leaders use prescriptive analytics to get ahead. One airline grew revenue by 15% using these tools. Most teams stick to descriptive analytics. They only see what happened. You need a better plan to win.
1. Descriptive Analytics: Understanding What Happened
Descriptive analytics acts as your starting point. You use this method to look at historical data and see how your business performed. It answers the question: What happened?
This phase uses business intelligence tools to turn messy numbers into clear reports. Understanding the different types of analytics helps you build a solid foundation.
A) Defining Descriptive Analytics
This stage uses raw data to show past performance. While other types of analytics look forward, this one tracks past wins and losses. You can use these reports to make data-driven decision making a standard part of your routine. This visibility is vital for all types of analytics you choose to implement.
B) Real World Examples of Descriptive Analytics
- E-commerce: You view monthly sales dashboards to see revenue by product category.
- Manufacturing: You check daily production reports to track units and downtime metrics.
- Healthcare: Providers monitor patient volume reports to understand throughput.
C) Strengths and Limitations of Historical Reporting
This stage gives you clear visibility. However, it only looks backward. You see the result but not the reason. Teams use real-time analytics to keep these reports current. This ensures your future predictive analytics models start with accurate facts. Knowing your history is vital for any of the types of analytics you use.
C) The Foundation for Advanced Analytics
High-quality business intelligence here makes your future goals reachable. You need this base to use more complex types of analytics later. Once you see the numbers, you must find out why they changed.
2. Diagnostic Analytics: Discovering Why It Happened
Once you see your numbers, you need to understand the cause. This is where diagnostic analytics comes in. It moves beyond simple reporting to explain why specific outcomes occurred. By using these types of analytics, you can uncover the specific drivers behind your business trends.
A) Defining Diagnostic Analytics
This stage uses techniques like root cause analysis to find relationships within your data. While descriptive analytics shows the “what,” this method uncovers the “why.”
It allows for data-driven decision making based on actual evidence rather than guesses. Using different types of analytics ensures you don’t just react to symptoms but fix the real problems.
B) Real World Examples of Diagnostic Analytics
- Retail: You find that a specific product discontinuation caused a 10% revenue drop.
- SaaS: You analyze cancellations to identify that a new feature caused user confusion.
- Manufacturing: You use root cause analysis to see that machine downtime came from a specific part failure.
C) Strengths and Limitations of Root Cause Analysis
This method helps you build targeted responses. It provides the context you need for future predictive analytics models. However, it still looks at the past. Its success depends on your data quality. Using augmented analytics can help your team find these patterns faster.
D) The Natural Progression of Data Analysis
Understanding the “why” is the next logical step in the analytics maturity model. Once you find the cause, you can start to look forward.
Now that you know why things happened, it is time to forecast what will happen next.
3. Predictive Analytics: Forecasting Future Outcomes
After understanding the past, you need to look ahead. Predictive analytics uses statistical algorithms and machine learning forecasting to project what is likely to happen next. By using these types of analytics, you can anticipate risks and find new opportunities before your competitors do.
A) Defining Predictive Analytics
This method identifies patterns in historical data to predict future results. It is a major step in the analytics maturity model. Unlike backward-looking reports, these types of analytics provide a forward-looking view. This allows for proactive data-driven decision making that prepares your team for upcoming shifts.
B) Real World Examples of Predictive Analytics
- Logistics: You use weather and traffic data to forecast delivery times with high accuracy.
- Telecom: You analyze behavior to predict which customers might leave, allowing for early retention efforts.
- Finance: Banks use economic trends and machine learning forecasting to predict loan default risks.
C) Strengths and Limitations of Forecasting
The ability to see ahead helps you manage resources better. However, these results are probabilistic. They are not guarantees. These models rely on steady data and may struggle with sudden market changes. Using these types of analytics requires constant tuning to stay accurate.
D) Machine Learning and Automated Forecasting
Modern systems use augmented analytics to automate these models. This creates a loop where your predictive analytics get better over time. It transforms your business intelligence from static reports into a dynamic tool.
4. Prescriptive Analytics: Recommending the Best Path Forward
Prescriptive analytics represents the peak of the analytics maturity model. It moves beyond forecasting to suggest specific actions. By using optimization algorithms, these types of analytics show you exactly how to reach your goals.
This ensures your data-driven decision making is both fast and accurate.
A) Defining Prescriptive Analytics
This method combines historical facts and predictive analytics to find the best path. It answers the question: What should we do? Unlike other types of analytics, this one provides a direct recommendation. It allows you to use real-time analytics to adjust your strategy on the fly.
B) Real World Examples of Prescriptive Analytics
- Airlines: You use dynamic pricing to adjust ticket costs based on current demand.
- Retail: You combine predictive analytics with inventory data to automate reorder quantities.
- Logistics: Systems recommend the fastest routes to reduce fuel costs by 25%.
C) Strengths and Limitations of Optimization
These types of analytics evaluate many scenarios at once to find the best result. While implementation is complex, the ROI is high. Tools like Metrixs simplify this by using augmented analytics to handle the heavy math.
This helps you reduce operational costs by 15% through smart resource allocation within your types of analytics strategy.
D) AI and the Future of Strategy
In 2026, AI turns these types of analytics into a continuous loop. You no longer wait for weekly reports to make a move. Using machine learning forecasting alongside prescriptive tools ensures you stay ahead of every market shift.
4 Types of Analytics At a Glance:
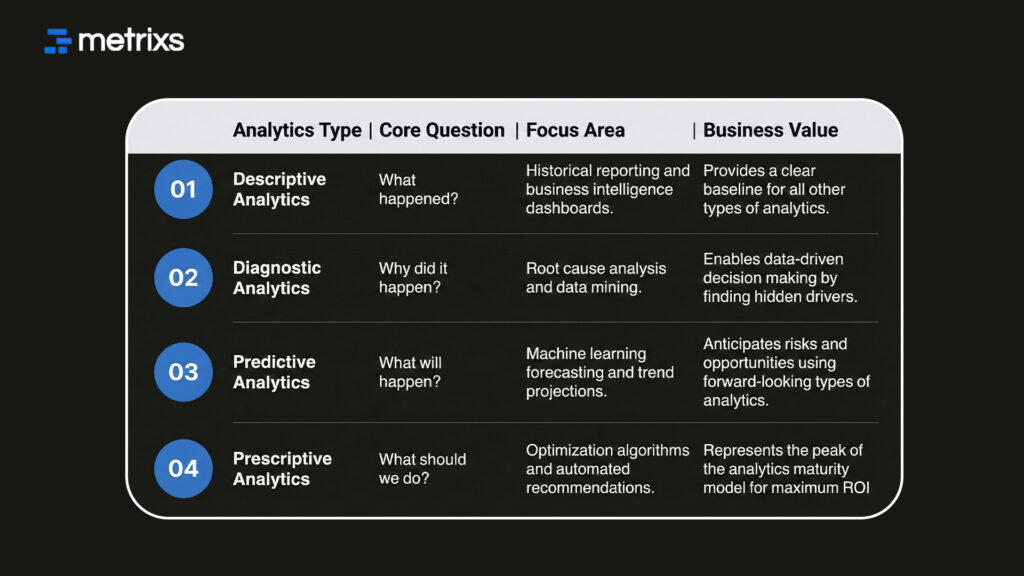
Now that you can see what is coming, you need to decide the best path to take.
Master All 4 Types of Analytics with Metrixs
Metrixs delivers advanced reporting for Microsoft Dynamics 365. It helps you unify all types of analytics across your business. You turn raw ERP data into clear insights for finance and inventory.
With 1,000+ metrics, you get 80% faster descriptive analytics and 99.9% accuracy.
Key Strengths:
- Rapid Integration: Setup takes under six weeks to improve your analytics maturity model.
- Data Snapshots: You get real-time analytics for better data-driven decision making.
- Global Reach: Track multiple currencies for consistent reporting across locations.
- Efficiency: Use predictive analytics to reduce operational costs by 15%.
Metrixs helps you use your ERP as a growth tool. You gain the speed needed to scale using the best types of analytics. Explore Metrixs to turn your ERP into a high-speed growth engine.
Conclusion
Many businesses struggle with siloed data and slow reports. If you rely only on basic types of analytics, you stay blind to upcoming market shifts. This delay leads to missed revenue and rising costs. Without a clear analytics maturity model, your competitors will outpace you while you guess your next move.
You need a way to fix these gaps before they sink your growth. Metrixs solves this by turning your ERP into a source for real-time analytics. You get the speed and accuracy required for true data-driven decision making and long-term success.
Stop guessing your future and start leading your industry. Connect with Metrixs to unlock the full power of your data today.
FAQs
1. What is the difference between the 4 types of analytics and why does the distinction matter?
The four types of analytics serve different goals. Descriptive analytics shows what happened, while diagnostic analytics finds the cause. Predictive analytics forecasts results, and prescriptive analytics suggests actions. Knowing this helps you build a solid analytics maturity model for growth.
2. How do organizations implement all 4 types of analytics without overwhelming existing teams?
Start by mastering descriptive analytics to stabilize your reporting. Once ready, add real-time analytics to improve data-driven decision making. Using a staged approach keeps your team focused while you climb the analytics maturity model and adopt advanced types of analytics.
3. What are the most common analytics implementation failures and how do organizations avoid them?
Most failures happen due to poor data quality or skipping steps in the analytics maturity model. Avoid this by ensuring your business intelligence tools are accurate. Focusing on the right types of analytics early prevents costly errors and ensures better results.
4. How do organizations measure progress through the analytics maturity model?
Track how often your team uses predictive analytics to influence outcomes. High-performing teams move from simple reporting to data-driven decision making. Measuring these types of analytics helps you identify gaps and ensures your data stays accurate and actionable for everyone.
5. What role does AI play in advancing analytics maturity?
AI automates machine learning forecasting to find patterns humans miss. It speeds up your transition between different types of analytics. Using AI-powered augmented analytics ensures your prescriptive analytics stay sharp, allowing for faster responses to changing market conditions and trends.
6. How do organizations maintain analytics momentum and prevent maturity regression?
Keep your team trained on the latest types of analytics. Focus on wins from predictive analytics to prove value. By tying real-time analytics to your goals, you ensure that data-driven decision making remains a core part of your company culture.

