
Stop guessing if your business makes money. Most owners look at bank balances and assume they are doing well. That is a mistake. You need a clear profitability analysis to see the truth. Many companies lose cash on specific products without even knowing it.
This guide shows you how to track your financial performance and perform a cost analysis with clarity. You will learn to use profit margin data to grow your cash flow. Use this profitability analysis guide to fix your bottom line today.
Fundamentals of profitability analysis and Why It Matters
Understanding your numbers keeps your business alive. A deep profitability analysis looks past total revenue to see what actually works. You might see high sales but low cash.
This happens when costs hide in the background. Your financial performance depends on knowing where you earn a return.
Why this matters:
- It stops profit leaks.
- It sets a better profit margin for every service.
- it identifies your best customer profitability segments.
- It simplifies your break-even analysis.
Use a profitability analysis to find hidden costs. You can then fix your pricing and improve your financial metrics. This keeps operations lean and highlights your business profitability.
Stop looking at growth as your only goal. Focus on the actual money you keep. This cost analysis reveals the path to real growth. You need a profitability analysis to stay ahead.
Method 1 & 2 – Margin Analysis and Break-Even Analysis
You need to start with the basics to fix your cash flow. These two methods form the core of a strong profitability analysis. They show you how much money you keep and how much you must sell to stay safe.
Method 1: Gross, Operating, and Net Profit Margin Analysis
You use margin analysis to see where your value goes. Start with gross profit margin. This shows what stays after you cover the cost to make a product. If you spend $40 to make a $100 item, you have a 60% gross profit margin. This profitability analysis step highlights your pricing power. A low number here means your cost analysis is off.
Use these to track your profit margin at every step:
- Gross Profit Margin = (Revenue – Cost of Goods Sold) / Revenue × 100
- Operating Profit Margin = Operating Profit / Revenue × 100
- Net Profit Margin = Net Income / Revenue × 100
Next, check your operating profit margin. This includes rent and payroll. It tracks how you manage daily work. If this falls, your financial performance takes a hit. Finally, net profit margin is your final take-home pay.
Comparing these three reveals where cash leaks. It is the best way to track business profitability. This profitability analysis reveals if your profit margin is healthy at every level.
Method 2: Break-even analysis
A break-even analysis finds the exact sales volume you need to cover costs. It removes the stress of wondering if you can pay the bills. You look at fixed costs like rent and variable costs like materials. This profitability analysis tool helps you set targets that make sense.
This tells you the exact volume needed for business profitability:
- Break-Even Units = Fixed Costs / (Price Per Unit – Variable Cost Per Unit)

If your rent is $5,000 and you earn $50 per sale, you need 100 sales. This step improves your financial metrics by showing your risk. It is a part of your financial performance review.
You can see how a price hike changes your goals. A solid break-even analysis gives you the data to grow with confidence. Use these methods to keep your profitability analysis accurate. This profitability analysis keeps your business safe.
Method 3 & 4 – Activity-Based Costing and Customer Profitability Analysis
These advanced methods dig deeper into your spending habits. You move past general averages to see exactly what drives your financial performance. This part of your profitability analysis highlights specific areas where you can save or earn more.
Method 3: Activity-Based Costing (ABC)
Activity-based costing helps you see the true cost of your work. Traditional math often spreads overhead costs like rent or power equally. This is a mistake. Some products use more resources than others. A cost analysis using ABC assigns these costs to the specific tasks that use them.
Use this for a precise cost analysis of your overhead:
- Activity Rate = Total Cost of Activity Pool / Total Activity Driver

For example, a complex product might need more quality checks. ABC puts that cost on that specific item. This profitability analysis reveals if your “premium” products actually lose you money. You can then adjust your profit margin to cover those hidden efforts. It provides a better look at your business profitability by focusing on real work. Use this activity-based costing to find your most efficient processes.
Method 4: Customer Profitability Analysis
Not every customer is a good one. A customer profitability analysis ranks your clients by the money they actually bring in. You might have a high-revenue client who calls your support team every day. After you pay for that support, your net profit margin on them might be zero.
This shows the real value of your clients for your profitability analysis:
- Customer Profit = Total Revenue from Customer – (Total Acquisition Costs + Service Costs + Retention Costs)

Use this profitability analysis to segment your base:
- Tier A: Low-maintenance clients with a high profit margin.
- Tier B: High-revenue clients who need a lot of help to stay.
- Tier C: Clients who cost more to keep than they pay.
Tracking your financial metrics this way helps you decide where to spend your marketing budget. You can focus on finding more “Tier A” clients to boost your financial performance.
This profitability analysis makes your growth sustainable. It ensures your customer profitability stays high. You stop chasing bad revenue and start building a better profitability analysis strategy.
Method 5 & 6 – Cost-Volume-Profit Analysis and Scenario Planning
You need to look ahead to keep your business healthy. These two methods turn your past data into a roadmap for the future. They help you test new ideas before you spend any cash on a new project. A forward-looking profitability analysis ensures your financial performance stays strong during market shifts.
Method 5: Cost-Volume-Profit (CVP) Analysis
Cost-Volume-Profit analysis shows how changes in your business affect your bottom line. You focus on your contribution margin. This is what stays from a sale after you pay for your variable costs. A profitability analysis using CVP helps you answer “what if” questions with ease.
This identifies how changes impact your financial metrics:
- Contribution Margin = Sales – Variable Costs
- Contribution Margin Ratio = (Sales – Variable Costs) / Sales

This profit margin math gives you the answer to growth questions. It is a vital financial metrics tool for your planning sessions. You can see if a new marketing spend will pay for itself. It keeps your profitability analysis focused on real growth. Use CVP to find the best mix of products for your business profitability.
Method 6: Scenario Planning and Predictive Modeling
The market changes fast. Scenario planning helps you prepare for any situation. You create a profitability analysis for three specific cases: a base case, a best case, and a worst case. This keeps your financial performance stable even during a market dip.
Predictive modeling uses your old data to guess what happens next. It helps you see a dip in your net profit margin before it actually happens. This proactive cost analysis saves you from nasty surprises.
You can adjust your goals based on real trends you see in the data. A strong profitability analysis always includes these future checks. It ensures your financial performance stays high no matter what happens in your industry. You get a clear view of your business profitability for the long term.
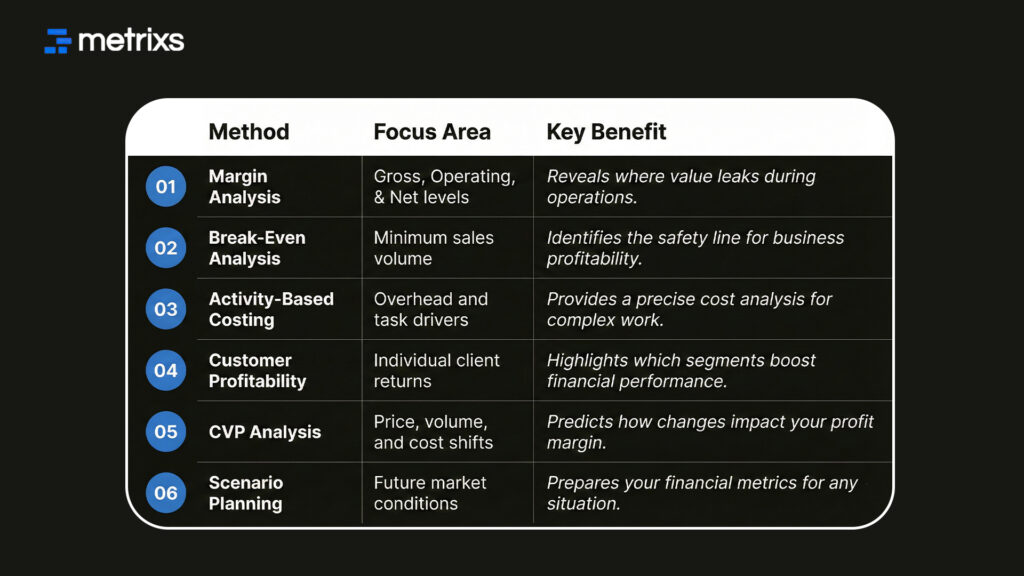
Quick Glance: 6 Methods for Profitability Analysis
How Metrixs Automates Advanced Profitability Analysis
Metrixs transforms your ERP data into a clear profitability analysis engine. It connects directly to Microsoft Dynamics 365 to turn raw numbers into a unified view of your financial performance. You eliminate manual errors and get 99.9% data accuracy across your entire organization.
Special Features:
- Rapid Integration: Start your profitability analysis in under six weeks with a seamless setup.
- On-Demand Snapshots: Instantly see a profit margin trend or an inventory flow for fast decisions.
- Multi-Region Flexibility: Track different currencies for consistent financial metrics globally.
- Centralized Oversight: Automate your cost analysis and summaries to save time.
Metrixs helps you reduce costs by 15% and improves your business profitability. Scale your profitability analysis with speed and accuracy by exploring Metrixs today.
Conclusion
A solid profitability analysis is the backbone of your strategy. It reveals the truth about your financial performance. Yet, many teams struggle with manual data entry and siloed reports. These issues turn a simple cost analysis into a mess of errors.
If you get your profitability analysis wrong, you will lose significant cash. You might invest in failing products or ignore your best profit margin opportunities until it is too late. This leads to total business failure.
Metrixs solves this by automating your financial metrics directly from your ERP. It gives you the clarity to act fast and keep your business profitability high. Use a real-time profitability analysis to save your bottom line.
Frequently Asked Questions
1. What is profitability analysis and why do I need it?
Profitability analysis reveals which parts of your business earn the most cash. It tracks your financial performance by looking at your profit margin and business profitability. You need it to identify high-value customer profitability and perform an accurate cost analysis to grow.
2. How do I calculate my business profit margin?
To find your profit margin, subtract your costs from your revenue and divide by total sales. A deep profitability analysis tracks your net profit margin and gross profit margin to ensure your financial performance stays high. Use this to improve your financial metrics.
3. Why is break-even analysis vital for my strategy?
A break-even analysis identifies the exact sales volume needed to cover all expenses. It is a core part of your profitability analysis that reduces risk. By tracking this financial performance metric, you ensure your business profitability stays safe during slow months.
4. How does activity-based costing improve my cost analysis?
Activity-based costing assigns overhead to specific tasks instead of using broad averages. This improves your profitability analysis by showing the real cost of every product. It helps you fix a low profit margin and boosts your financial performance through a precise cost analysis.
5. How can I automate my profitability analysis?
You can automate your profitability analysis using Metrixs to pull data directly from your ERP. This ensures 99.9% accuracy for your financial metrics and financial performance reports. It simplifies your cost analysis and helps you scale your business profitability with real-time insights.

