
Finance teams feel buried under spreadsheets. Just 34% of companies find real value in their data. This gap exists because they lack a clear system for financial performance reporting.
With IFRS 18 changes starting next year, you need a framework that turns data into strategy. This guide breaks down CFO reporting into 18 tools. Focus on monthly financial statements like the profit and loss statement to gain control over your growth.
Effective financial performance reporting ensures you manage what you measure. Metrixs automates these KPI metrics so you can lead with facts.
Core Financial Statements and Performance Reporting
Build your foundation on facts. These six reports form the base of your financial performance reporting. They provide the raw data needed for CFO reporting and ensure your monthly financial statements remain accurate and useful for growth.
Report 1 – Income Statement (Profit & Loss)
Your profit and loss statement tracks revenue and expenses. You use it to see if the business makes money. A 12-month trend helps you spot margin slips before they drain your bank account. This is a primary piece of financial performance reporting.
- Track your gross margin percentage to check pricing power.
- Use performance metrics to compare results against your budget review.
- Monitor operating income to see core business efficiency.
Report 2 – Cash Flow Statement
A cash flow statement shows how money moves in and out. It proves if your sales turn into actual cash. High-quality financial performance reporting relies on this to confirm you can pay your bills on time every month.
- Watch operating cash flow to confirm business viability.
- Review liquidity analysis to spot cash gaps before they happen.
- Calculate free cash flow for growth and reinvestment opportunities.
Report 3 – Balance Sheet
The balance sheet is a snapshot of what you own and what you owe. It shows your health at a specific point in time. Strong financial performance reporting uses this to manage debt and assets while protecting your cash.
- Check the current ratio to ensure you cover short-term debt.
- Manage working capital to keep daily operations running smooth.
- Look at debt-to-equity to judge your overall financial risk level.
Report 4 – Cash Forecast (Rolling 13-Week)
Use financial forecasting to look ahead. A 13-week forecast tells you exactly when cash might get tight. It is one of the most useful performance metrics for survival. Without it, your financial performance reporting just looks backward.
- Perform a liquidity analysis to plan for all future spending.
- Project your net monthly cash position with high accuracy.
- Build a liquidity buffer to handle any unexpected business costs.
Report 5 – Budget vs. Actual Analysis
This report uses variance analysis to explain why you missed your goals. It keeps your monthly financial statements grounded in reality. You learn if spending is out of control or if sales are lagging. CFO reporting requires this check.
- Identify the root cause of every large variance analysis gap.
- Adjust your financial forecasting based on actual results.
- Hold your teams accountable for hitting their KPI metrics.
Report 6 – Revenue Report with Trend Analysis
Improve your financial performance reporting by looking at where your money comes from. Trend analysis reveals if your growth is steady. Use CFO dashboards to visualize these patterns so you can make faster decisions about where to invest.
- Break down revenue by customer segment and product line.
- Watch for customer concentration to lower your overall risk.
- Check month-over-month growth to see how fast you are scaling.
Once you master the basic numbers, you must look at how your daily operations impact your bank account.
Operational and Cash Flow Performance Reporting
Daily operations determine your long-term success. These reports focus on your cash speed and spending habits. They turn your monthly financial statements into a roadmap for efficiency and growth. Use Metrixs to improve your financial performance reporting and keep your business lean.
Report 7 – Gross Margin Analysis
Your gross margin percentage tells you if your pricing covers your costs. If this number drops, your financial performance reporting should flag it immediately. It reveals how much gross profit you keep after every sale. This is one of the most important performance metrics for any product business.
- Watch your cost of goods sold for sudden price hikes.
- Compare margins across different product lines to see what works.
- Use this data to set better prices and increase profit.
Report 8 – Operating Expense Analysis
Track every dollar your departments spend to stay profitable. Use a budget review to see if your team stays on track each month. This report helps you protect your operating income from unnecessary waste and ensures you hit your goals. Strong financial performance reporting makes these costs easy to see.
- Identify which departments overspend their assigned budget.
- Look for recurring costs you can cut or renegotiate.
- Keep your total expenses aligned with your actual revenue.
Report 9 – Accounts Receivable Aging Report
This report shows who owes you money and how long they have held it. It is a vital part of your cash flow statement health. Fast collections improve your financial performance reporting results and provide more capital. You need this to manage your daily cash needs.
- Check for customers who take over 90 days to pay you.
- Set KPI metrics for your collections team to follow.
- Review this report weekly to keep your cash moving fast.
Report 10 – Accounts Payable Aging Report
Manage what you owe to keep your vendors happy and your supply chain strong. It helps you see upcoming hits to your balance sheet before they happen. Good CFO reporting ensures you never miss a payment or a discount opportunity. It simplifies your financial performance reporting tasks.
- Identify which bills you must pay first to avoid fees.
- Perform a liquidity analysis on your upcoming debt obligations.
- Maintain strong supplier ties by paying on time every month.
Report 11 – Working Capital Analysis
This measures your ability to turn assets into cash. It is a vital sign in your financial performance reporting process. High working capital means you have the power to grow without taking on new debt. Use your monthly financial statements to track this trend over time.
- Calculate your current assets minus your current liabilities monthly.
- Check your cash conversion cycle to see how fast you scale.
- Use this insight to fund expansion and new projects.
Report 12 – Liquidity Dashboard
A dashboard gives you a live view of your cash runway. It pulls data into CFO dashboards for a quick health check. This tool makes CFO reporting fast and effective for busy leaders who need answers now. It is the peak of modern financial performance reporting tech.
- Monitor your daily cash burn rate to stay safe.
- Check your available credit lines and total cash often.
- Set alerts for when your cash drops below a certain level.
These operational tools show you the current health of your business, but you also need to look ahead.
Strategic and Forward-Looking Performance Reports
Strategic reports help you see the future. These tools use your financial performance reporting data to predict what comes next for your company. By using these CFO reporting metrics, you turn your monthly financial statements into a roadmap.
Financial performance reporting should always provide these forward-looking views to keep you competitive and ready.
Report 13 – Sales Forecast and Pipeline Report
A sales forecast predicts your income. It uses financial forecasting to show how current deals will hit your profit and loss statement later. Good financial performance reporting combines sales data with cash needs to prevent gaps. Use CFO dashboards to track this pipeline and adjust your spending based on real sales expectations.
- Track the total value of your sales pipeline every month.
- Use conversion rates to improve your financial forecasting accuracy.
- Align your hiring plans with your projected sales growth.
Report 14 – Key Performance Indicators (KPI) Dashboard
Your KPI metrics act as an early warning for your business. This dashboard tracks data that eventually changes your monthly financial statements. It is a core part of financial performance reporting that keeps your team focused on the right goals. CFO reporting is more effective when you see these performance metrics in real-time.
- Monitor your customer acquisition cost to ensure efficient growth.
- Track churn rates to protect your future revenue stream.
- Use performance metrics that match your specific industry goals.
Report 15 – Variance Analysis and Root Cause Investigation
Go beyond the numbers to find out why your results differ from your plan. This deeper variance analysis explains the “why” behind your financial performance reporting results. It is a vital CFO reporting task that helps you fix problems at the source. This ensures your monthly financial statements stay aligned with your long-term business goals.
- Identify if a miss was a one-time event or a trend.
- Document the specific actions you will take to fix variances.
- Share these insights to improve financial performance reporting across teams.
Report 16 – Profitability by Segment
Not all revenue is equal. This report breaks down your profit and loss statement by product, customer, or region. It is a powerful financial performance reporting tool that shows where to invest your capital. By using these performance metrics, you can stop wasting money on segments that do not provide a high gross profit.
- See which specific products provide your highest gross profit.
- Identify customers who cost more to serve than they are worth.
- Use this financial performance reporting data to spend your budget wisely.
Strategic insights help you plan your path, but you must also keep your business safe and compliant.
Compliance, Risk, and Strategic Reporting
Protecting your business is just as important as growing it. These reports ensure your financial performance reporting includes safety checks for debt and taxes. By adding these to your CFO reporting package, you keep stakeholders happy and avoid legal trouble.
These reports turn your monthly financial statements into a shield against risk.
Report 17 – Debt and Capital Management Report
Managing your debt keeps your business stable. This report tracks your loans and interest costs to ensure they don’t eat your operating income. High-quality financial performance reporting monitors these obligations monthly so you can plan for future payments. Use CFO dashboards to stay on top of your bank requirements.
- Monitor your debt-to-equity ratio to manage overall financial risk.
- Track every loan maturity date to avoid sudden cash drains.
- Ensure you meet all bank covenants to keep your credit lines open.
Report 18 – Tax and Compliance Summary
Tax laws change fast, and mistakes are expensive. This report tracks your tax needs and filing dates to prevent fines that hurt your profit and loss statement. Effective financial performance reporting includes a clear view of what you owe the government. Use these performance metrics to stay organized and ready for any audit.
- List all upcoming tax deadlines to avoid late payment fees.
- Track your estimated tax payments against your actual budget review.
- Review your internal control assessments to keep your data secure.
Keeping your data safe and accurate is a big job, but technology can do the heavy lifting for you.
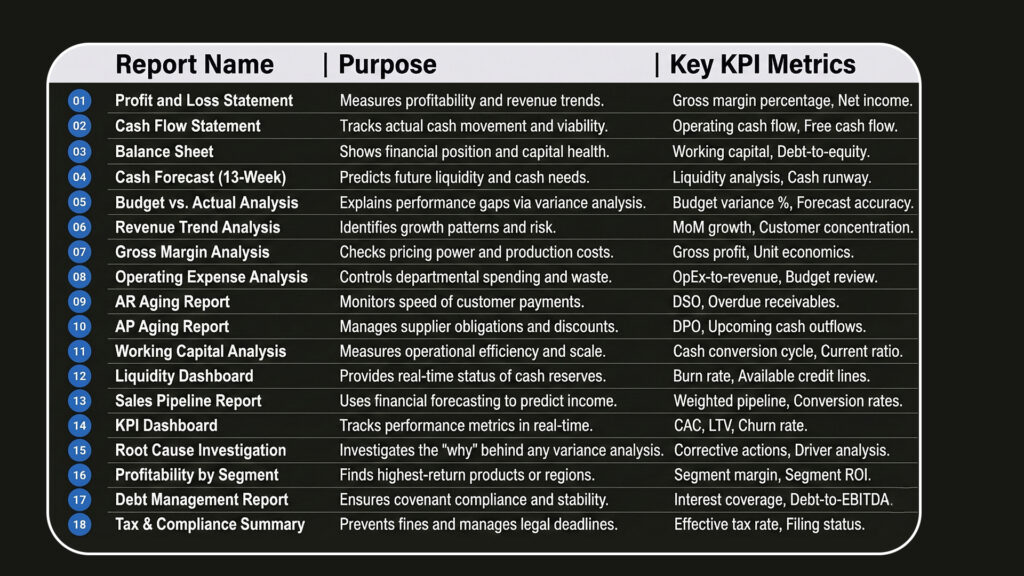
Quick Glance: 18 Essential Reports for CFO Reporting
Drive Smarter Decisions: Transforming Your Financial Reporting with Metrixs
Metrixs turn your ERP into a powerful growth engine. It automates financial performance reporting by pulling real-time data from Microsoft Dynamics 365 and other systems.
This ensures your CFO reporting is 80% faster and 99.9% accurate. Instead of manual data entry, you get a unified view of your monthly financial statements to drive growth.
- Rapid Integration: Launch your automated financial performance reporting system in under six weeks.
- Library of Metrics: Access over 1,000 KPI metrics and 100+ pre-built reports instantly.
- Global Visibility: Track multiple currencies and regions for consistent CFO reporting across all locations.
- Cost Reduction: Use smart insights to lower operational costs by 15% within your financial performance reporting strategy.
Automate your financial performance reporting with Metrixs today. Schedule a demo to see how we simplify your monthly financial statements and CFO reporting.
Conclusion
Excellent financial performance reporting separates leaders from those who just react to crises. While many leaders use data for financial forecasting, few extract real value. This 18-report framework gives you the clarity to make better choices. By tracking your monthly financial statements and KPI metrics consistently, you gain a competitive edge.
Start with basics like your profit and loss statement and cash flow. Add complex performance metrics as your needs grow. This disciplined approach ensures you always know your cash position and profit drivers.
Proper measurement dictates your success. Use these reports to turn data into action and lead with confidence. Metrixs simplifies this process by automating your CFO reporting and delivering real-time insights for smarter decision-making.
Ready to automate your financial performance reporting? Schedule a demo with Metrixs today to simplify your CFO reporting and lead with confidence.
FAQs
1. Why do CFOs need 18 reports beyond standard statements?
Standard monthly financial statements show the past, but financial performance reporting predicts the future. Using 18 reports provides deeper KPI metrics and variance analysis. This level of CFO reporting helps you manage gross profit and cash more effectively.
2. How frequently should I review these financial reports?
Check your cash flow statement daily to ensure liquidity. Review your profit and loss statement and performance metrics monthly for better CFO reporting. Regular financial performance reporting ensures your financial forecasting stays accurate as your business grows.
3. How can I organize 18 reports without feeling overwhelmed?
Use CFO dashboards to group your KPI metrics into tiers. Prioritize your monthly financial statements and liquidity analysis first. Automated financial performance reporting tools like Metrixs simplify CFO reporting by highlighting the most critical data points instantly.
4. What technology best supports complex financial reporting?
Enterprises use Metrixs to automate financial performance reporting directly from their ERP. This tech streamlines CFO reporting and eliminates manual errors in your monthly financial statements. It ensures your financial forecasting and KPI metrics remain 99.9% accurate.
5. How should I handle reports showing negative trends?
Perform a deep variance analysis to find the root cause immediately. Use your financial performance reporting data to adjust your budget review and protect your operating income. Fast CFO reporting allows you to fix issues before they impact your balance sheet.

