
Financial blindness kills more businesses than competitors do. Most companies use data for decisions. Many finance teams still work with poor tools. This creates a gap where you have too many spreadsheets. A financial dashboard changes this by providing real-time analytics.
It improves your financial performance through clear financial KPIs. These CFO metrics remove the guesswork from your daily operations. A financial dashboard from Metrixs lets you use business intelligence to protect your cash and grow. You gain better revenue tracking and see your numbers clearly every single day.
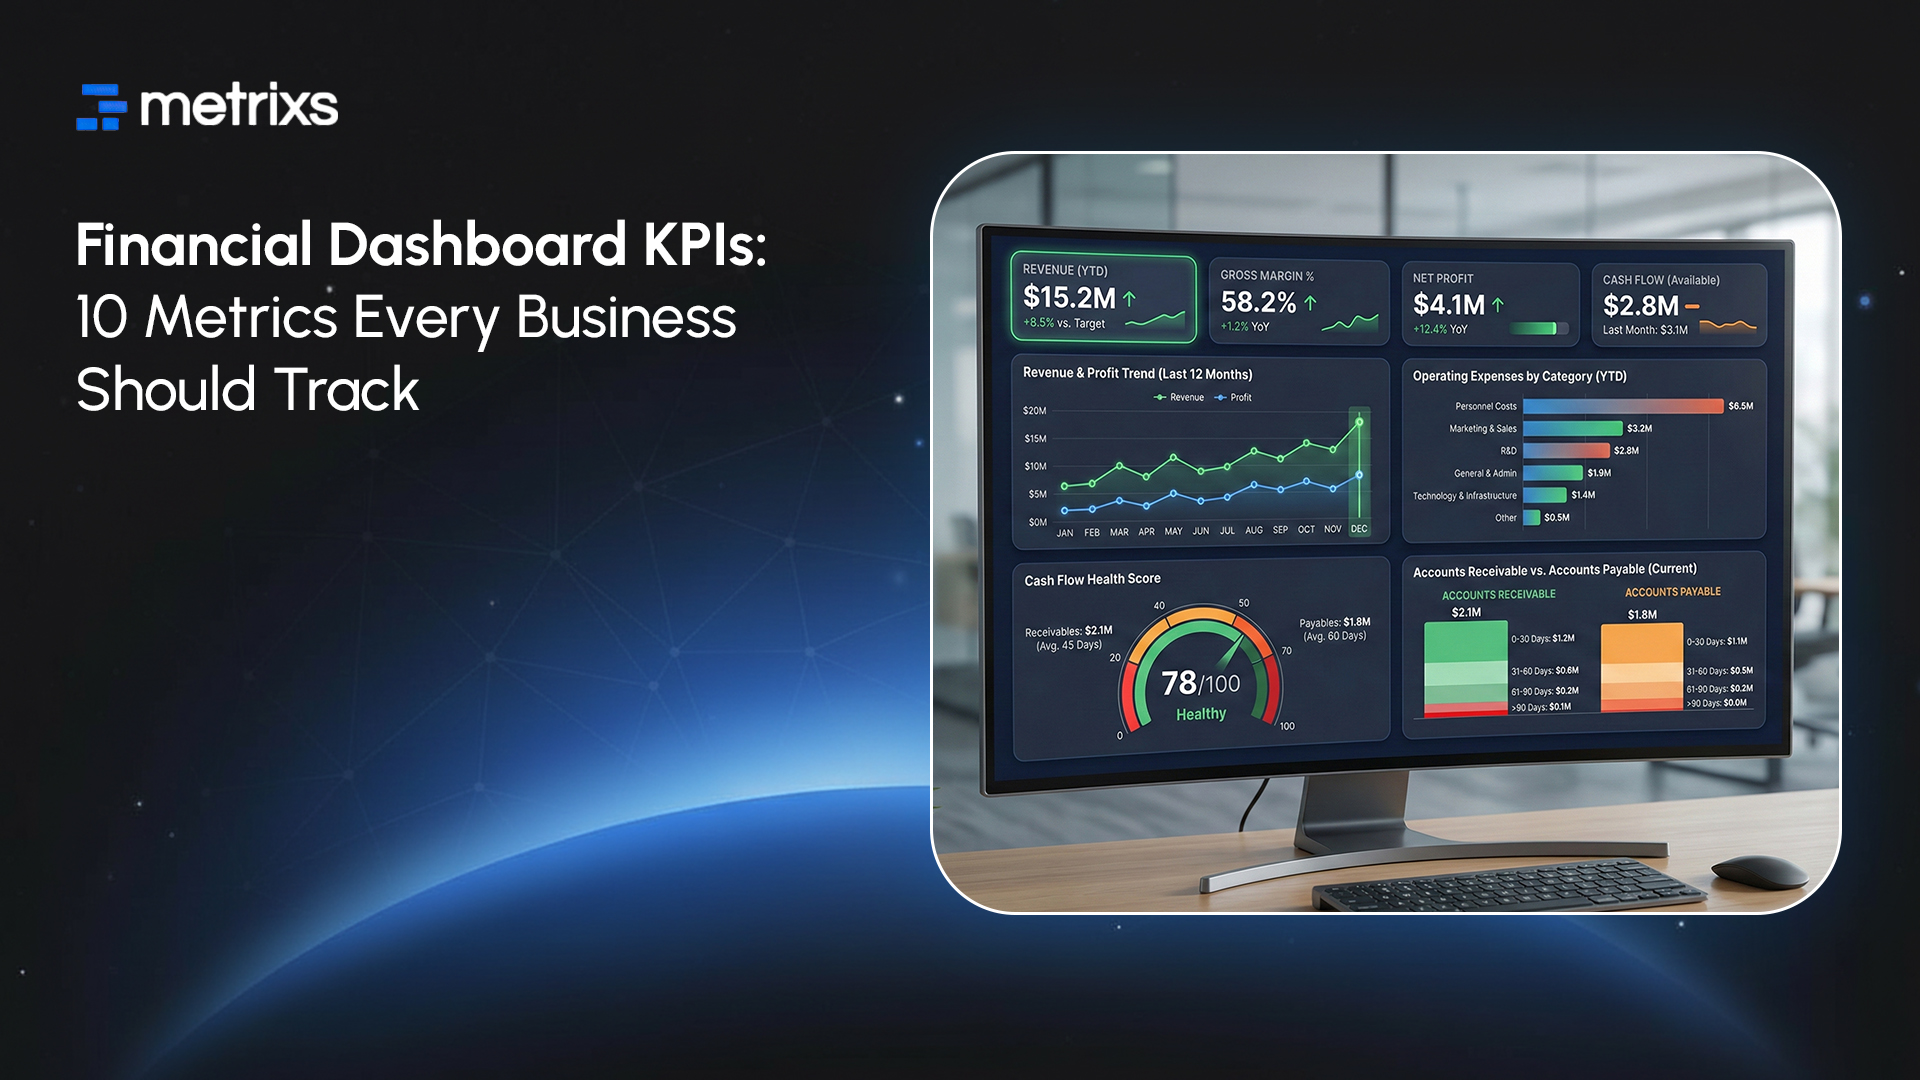
Why Financial Dashboard KPIs Matter More Than Ever in 2026
Markets move fast in 2026. You cannot wait for a monthly report to see if you lost money last week. Using a financial dashboard helps you stay ahead of sudden shifts. These financial KPIs show your current health instantly. Many businesses see a 340% ROI when they track CFO metrics properly.
A financial dashboard improves your financial performance through:
- Real-time analytics: You make decisions five times faster.
- Profitability metrics: You spot high expenses before they drain your bank account.
- Liquidity ratios: You ensure you always have cash for payroll.
- Revenue tracking: You identify growth trends as they happen.
Monitoring your financial dashboard stops small errors from becoming large failures. It turns static data into business intelligence that drives growth. You lead your industry. Others just guess. Your team stays ready for anything.
You need the right numbers to turn these benefits into results. Here are the ten CFO metrics every financial dashboard needs to drive your financial performance.
The 10 Essential Financial KPIs Every Financial Dashboard Must Track
Tracking the right numbers turns raw data into a plan for growth. Here are the first two CFO metrics your financial dashboard needs to monitor financial performance effectively.
1. Revenue Growth Rate
This financial KPI shows how fast your business expands. It measures the percentage increase in your income over a specific time. High revenue tracking accuracy helps you see if your sales strategies work or if you need to pivot.
Formula:
((Current Period Revenue – Previous Period Revenue) / Previous Period Revenue) x 100

2. Gross Profit Margin
Your financial dashboard must track this to show operational efficiency. It tells you how much money stays in the business after you pay for the goods or services you sell. Monitoring these profitability metrics daily protects you from rising supply costs.
Formula:
((Revenue – Cost of Goods Sold) / Revenue) x 100

3. Net Profit Margin
This financial KPI shows your actual bottom line. It measures how much profit you keep after paying all your bills, taxes, and interest. A financial dashboard tracking these profitability metrics proves if your growth is sustainable or if you are just burning cash. Use this to judge your overall financial performance.
Formula:
(Net Income / Revenue) x 100

4. Operating Cash Flow
Cash is king for any business. This metric shows the cash your core business generates. It ignores non-cash items like depreciation to show your true liquidity. Your financial dashboard needs this to ensure you have enough money to reinvest and pay your team. Strong cash flow management prevents sudden bankruptcy.
Formula:
Net Income + Non-Cash Expenses + Changes in Working Capital

5. Working Capital Ratio (Current Ratio)
This financial KPI measures your short-term financial strength. It shows if you have enough current assets to cover your current liabilities. Your financial dashboard uses this to signal potential debt problems before they happen. Healthy liquidity ratios usually sit between 1.2 and 2.0.
Formula:
Current Assets / Current Liabilities

6. Cash Conversion Cycle (CCC)
Your financial dashboard tracks the CCC to see how fast you turn inventory back into cash. It measures the time capital stays locked in your operations. Improving this cycle is a key part of cash flow management. A shorter cycle means your business has more money to spend on financial performance goals.
Formula:
Days Inventory Outstanding + Days Sales Outstanding – Days Payable Outstanding

7. EBITDA
EBITDA stands for Earnings Before Interest, Taxes, Depreciation, and Amortization. This financial KPI shows your core operational profit. It removes accounting and tax factors that hide your true financial performance. Your financial dashboard uses this to compare your company with others in your industry. It is one of the most vital CFO metrics for investors to see if your business model works.
Formula:
Net Income + Interest + Taxes + Depreciation + Amortization

8. Accounts Receivable Days Outstanding (DSO)
DSO measures how long it takes to collect payment from your customers. A financial dashboard tracking DSO helps you spot customers who pay late. High DSO hurts your cash flow management. Lowering this number increases your cash on hand. This is a key part of revenue tracking because a sale is only useful when you actually get the cash in your bank account.
Formula:
(Accounts Receivable / Total Credit Sales) x 365

9. Accounts Payable Turnover Ratio
This financial KPI shows how many times you pay off your suppliers in a period. Your financial dashboard tracks this to manage vendor relationships. If the ratio is too high, you might be paying too fast and hurting your cash on hand. If it is too low, you might be struggling to pay bills. Balancing this helps your expense monitoring and keeps your credit strong.
Formula:
Net Credit Purchases / Average Accounts Payable

10. Burn Rate and Cash Runway
These are the most important CFO metrics for startups. Burn rate shows how much cash you spend each month. Runway tells you exactly how many months you have before the cash runs out. Your financial dashboard must display this clearly to prevent a sudden crisis. Proper cash flow management requires knowing your runway at all times so you can plan your next fundraise or pivot.
Formula:
Current Cash Balance / Monthly Burn Rate

Knowing these financial KPIs is a great start, but manual tracking wastes time. You need a financial dashboard that handles the heavy lifting for you. Metrixs turn your raw numbers into clear business intelligence for better financial performance.
Quick Summary: 10 CFO Metrics for Your Financial Dashboard

Turn Raw Data into World-Class Financial Dashboards with Metrixs
Metrixs transforms your Microsoft Dynamics 365 Finance & Operations data into a powerful financial dashboard. You no longer have to fight with siloed spreadsheets or manual errors. Our platform provides real-time analytics and business intelligence that turn your ERP into a growth engine.
Metrixs improves your financial performance through:
- Rapid Integration: Connect your systems in under six weeks to start revenue tracking immediately.
- 1,000+ Metrics: Access a huge library of CFO metrics and pre-built reports.
- Multi-Region Flexibility: Track different currencies and global locations for consistent financial reporting.
- Centralized Oversight: Automate your balance sheets and expense monitoring to save hours of manual work.
- Measurable Impact: Use smart insights to cut operational costs by 15%.
Explore Metrixs to build a better financial dashboard that tracks your financial KPIs and improves your financial performance today.
Conclusion
Choosing the right financial dashboard KPIs determines if your business thrives or fails. Many teams struggle with data silos and manual errors that lead to “financial blindness.”
If you track the wrong CFO metrics, you risk making massive strategic blunders based on false numbers. One bad decision can drain your cash reserves and end your operations before you even spot the warning signs. You cannot afford to guess your financial performance in a volatile market.
Metrixs solves this by providing real-time analytics and accurate business intelligence. Our platform automates your financial reporting and revenue tracking to ensure you always have the truth.
Connect with Metrixs to simplify your financial reporting and see how a professional financial dashboard transforms your financial performance.
FAQs
1. What is a financial dashboard and why do you need one?
A financial dashboard provides real-time analytics by combining your financial KPIs into one view. It improves financial performance through better revenue tracking and cash flow management. You gain business intelligence that helps you avoid “financial blindness” and make faster decisions.
2. How many CFO metrics should you track daily?
Focus on 8 to 12 core CFO metrics to avoid data overload. Your financial dashboard should prioritize profitability metrics and liquidity ratios like working capital. Tracking too many numbers hides critical trends, while a focused set drives better financial reporting and growth.
3. What is the difference between leading and lagging indicators?
Lagging indicators like net profit margin show past results. Leading indicators like sales pipeline predict future financial performance. A balanced financial dashboard uses both for proactive expense monitoring. This mix ensures your business intelligence tools help you anticipate risks before they impact cash.
4. How often should you update your financial KPIs?
You should update liquidity-based financial KPIs daily for accurate cash flow management. Strategic profitability metrics like EBITDA usually update monthly. A financial dashboard from Metrixs automates these refreshes, ensuring your financial reporting stays current without manual work or human error.
5. Can small businesses benefit from these financial tools?
Yes, a financial dashboard helps small firms manage revenue tracking and expense monitoring like large enterprises. Using CFO metrics ensures you maintain healthy liquidity ratios to survive market shifts. Professional business intelligence tools allow smaller teams to scale their financial performance efficiently.

