

Bad data quality costs your company an average of $12.9 million every year. Most of this loss comes from ETL and business intelligence gaps rather than tool failures.
Even though the ETL market will hit $10.24 billion in 2026, teams still face 67 monthly pipeline incidents. Business users find 74% of these errors first. This means your reports are wrong before you even know it.
Poor data pipeline design and weak BI data architecture cause these issues. You lose money when you skip the design layer.
Use this guide to fix your stack.
The Part of ETL and Business Intelligence Nobody Designs First
Most teams buy a tool and start building immediately. They connect a source, run a script, and hope for the best. But they forget that ETL and business intelligence success depend on architecture, not just software. You need a data pipeline design that handles reality.
If you skip the schema design, your reports will fail. A strong BI data architecture keeps your data warehouse clean and useful. You must plan how your extract transforms the load tasks function. High-quality ETL and business intelligence setups require a clear blueprint.
A) What “Data Design” Actually Means in an ETL Context
Data design isn’t just a buzzword; it’s the technical blueprint for your ETL and business intelligence stack. It defines how your data pipeline design handles schema design, table relationships, and data transformation rules.
Most teams treat these as small details. But in reality, the ETL process consumes 31% of engineering effort just on normalization. If you don’t lock your data modeling early, your data warehouse becomes a mess.
Good design ensures high data quality from the source to the final dashboard. Without it, you poison every report with inconsistent metrics.
B) Where Fragile Scripting Enters and Never Leaves
Fragile scripts are the silent killers of ETL and business intelligence stability. These are one-off jobs built without a data pipeline design contract. They work today, but they crack the moment a source system changes a column name or a data type.
Without an automated ELT process or centralized version control, every minor change requires a manual fix. This creates a backlog that never goes away.
These brittle scripts turn your ETL and business intelligence workflow into a constant cycle of “firefighting.” Instead of improving the data warehouse, your engineers spend 15 hours on every resolution.
ETL & BI Design Failures: Quick Glance
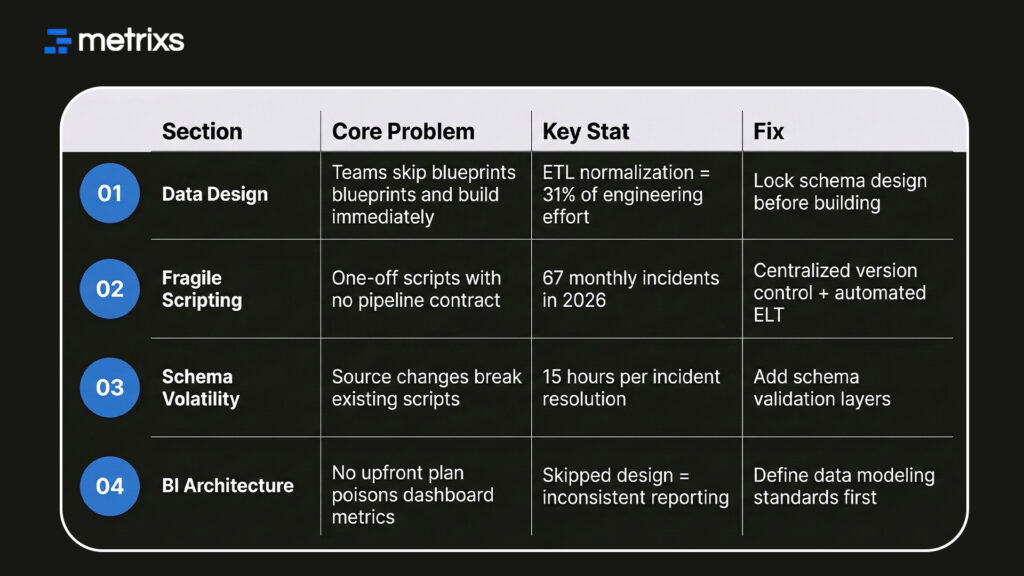
Moving away from these one-off fixes is the only way to protect your BI data architecture from constant downtime.
How Poor Data Pipeline Design Breaks BI Reporting Silently
When you skip the design phase, you invite invisible errors into your data warehouse. These aren’t system crashes; they are logic gaps that poison your ETL and business intelligence output.
1. Stale Data Flowing Into Live Dashboards
Fixed ETL batch schedules often mean your ETL and business intelligence dashboards run on yesterday’s numbers. You see a clean visual, but the data is actually outdated.
This happens because your data pipeline design creates latency gaps between the source and the data warehouse.
For example, a successful extract transform load job might pull data, but without a schema design contract, it might map a “null” value as a “zero.” This small mistake in your ETL pipeline can skew an entire quarter’s financial forecast.
You need real-time triggers and incremental loading patterns. These fixes only work if your BI data architecture includes them from the start.
2. Duplicate Records and Partial Loads That Don’t Flag Errors
Manual steps in an ETL pipeline often miss duplicate records. You might see the correct row count, but your data quality is actually poor. Without deduplication in the data transformation stage, these records flow into the data warehouse.
They surface in ETL and business intelligence reports as inflated revenue or double-counted customers. Built-in validation and row-level checks solve this problem.
You must include these logic steps in your original data pipeline design to prevent “dirty” data from ruining your business decisions.
3. The Cost Visibility Problem No One Measures
Inefficient backfills and noisy retry loops drive up your cloud bills. These costs accumulate without showing a single error in your ETL and business intelligence tools.
Organizations with poor data pipeline design often see cloud spend rise by 30–40% without getting better results. Decisions about batching and retry policies are data modeling choices.
They aren’t just operational fixes. They protect your BI data architecture budget from unnecessary waste.
What Data Design Actually Requires Before ETL and BI Go Live
You need more than just a connection string to make ETL and business intelligence work. You need a formal data modeling strategy. High-performance teams don’t just “load” data; they design it for consumption.
Building these requirements into your data pipeline design ensures that your data integration efforts actually scale.
1. Schema Contracts Between Source and Target Systems
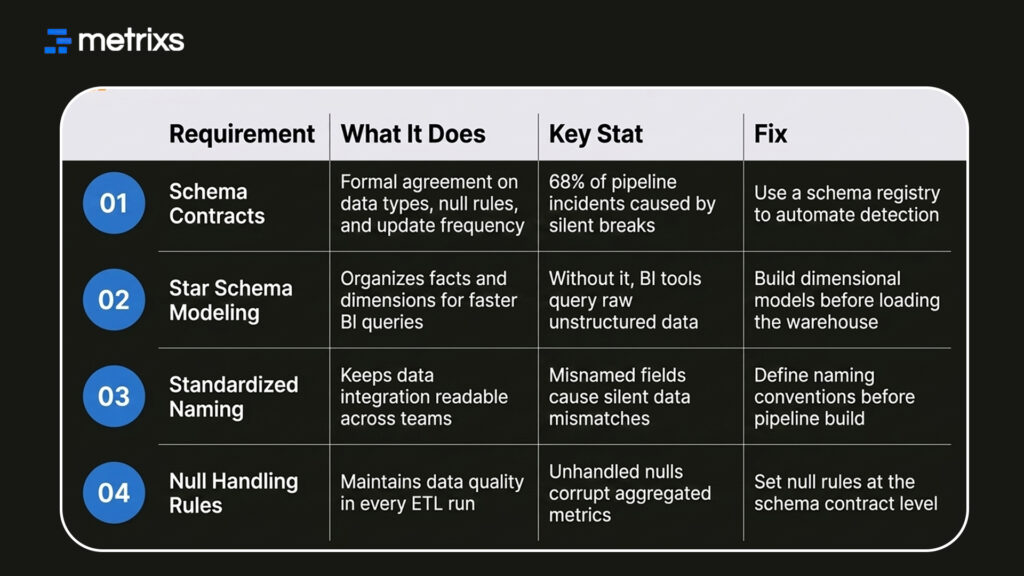
A schema contract is a formal agreement between systems. It defines data types, null rules, and update frequency for your ETL and business intelligence stack. When a developer renames a field at the source, the contract detects the change.
This prevents your ETL pipeline from loading malformed data. By using a schema registry, you automate data governance and protect your BI data architecture. This is how you stop the “silent breaks” that cause 68% of pipeline incidents.
2. Star Schema and Data Modeling for BI Consumption
Loading a data warehouse without a model forces your BI tool to work too hard. You should use a star schema to organize facts and dimensions.
This data modeling approach ensures that your ETL and business intelligence reports query pre-aggregated data. It stops “metric drift” and ensures that different departments see the same numbers.
A solid data transformation layer handles these joins before the data reaches the user. You need these four items for a successful rollout:
- Schema Contracts: Stop upstream changes from breaking your ETL pipeline.
- Dimensional Modeling: Speed up your BI data architecture dashboards.
- Standardized Naming: Ensure your data integration is easy to understand.
- Null Handling Rules: Maintain high data quality in every extract, transform, and load run.
Pre-ETL & BI Data Design Requirements: Quick Glance
Setting these rules early saves you from expensive rework later. This structural shift allows you to use modern patterns that fix your ETL and business intelligence health for good.
The 2026 Design Patterns for Fixing ETL and BI Architecture
Modern BI data architecture relies on automation and real-time responses. You can no longer wait for a nightly batch to see if your ETL pipeline worked.
1. Event-Driven Pipelines Over Fixed Batch Schedules
Batch processing was a product of expensive compute and slow systems. Today, event-driven ETL triggers your pipeline the moment source data changes. This design uses Change Data Capture (CDC) to detect row-level updates at the source.
It moves data incrementally into your data warehouse, keeping your ETL and business intelligence reports current. This pattern is now the default for companies that need same-day operational data.
2. Observability Built Into Pipeline Design, Not Added After
Adding monitoring after you build a pipeline is a mistake. You need data observability baked into your data pipeline design from day one.
This means your ETL pipeline tracks its own data quality scores and freshness. If you don’t build these hooks into your BI data architecture, you’ll always be one step behind the user.
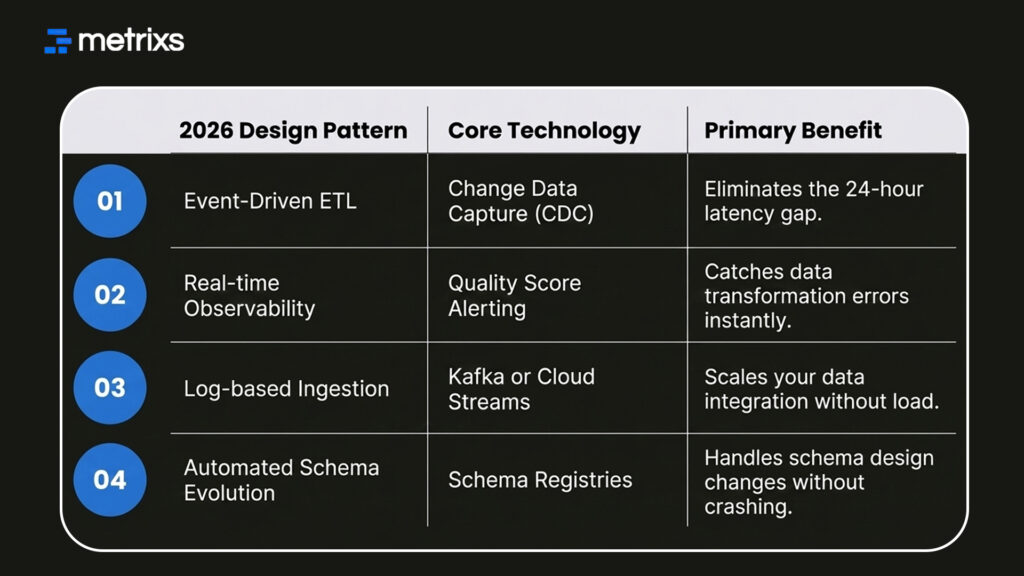
You should adopt these four patterns to modernize your stack:
- Switch to CDC: Stop doing full-table reloads and only move what changed.
- Automate Alerts: Set up triggers for when data quality drops below a threshold.
- Use Schema Registries: Manage your ETL and business intelligence versions automatically.
- Decouple Ingestion: Ensure your ELT process doesn’t slow down the source system.
These modern patterns provide the stability needed for high-stakes reporting. This is exactly how specialized platforms help you manage the complex data coming out of your ERP.
How Metrixs Builds the Data Foundation ETL and Business Intelligence Actually Depend On
Metrixs transforms Microsoft Dynamics 365 Finance & Operations data into a powerful engine for ETL and business intelligence. By automating your data pipeline design, it ensures 99.9% accuracy and 80% faster reporting.
- Rapid Integration: Deploy a stable data pipeline design in under six weeks.
- On-Demand Snapshots: Capture real-time trends for proactive ETL and business intelligence decisions.
- Multi-Region Flexibility: Ensure consistent global BI data architecture across all currencies.
- Centralized Oversight: Automate financial summaries to maintain a real-time view of ETL and business intelligence.
Our platform eliminates silos, creating a high-performance BI data architecture for your enterprise.
Conclusion
Success in ETL and business intelligence requires a design-first mindset, not just better tools. Skipping data pipeline design creates deep structural gaps that cause monthly failures.
When your BI data architecture lacks schema design and data quality checks, you risk 15-hour resolution times. These silent errors lead to catastrophic outcomes: double-counted revenue, stale reports, and millions in lost profits.
Your business decisions become a gamble based on a “dirty” data warehouse. You cannot afford to let your competitors see the truth while you chase broken links.
Metrixs solves this at the source by automating your data transformation and stabilizing your exact transform load tasks for Microsoft Dynamics 365. Stop guessing and start trusting your data.
Let’s connect with Metrixs and transform your ETL and business intelligence strategy into a high-performance engine today.
FAQs
1. What is FP&A Power BI used for?
FP&A Power BI automates your complex budgeting and forecasting by connecting directly to ERP and CRM data. This financial planning and analysis dashboard provides instant planning visibility into P&L and cash flow. Analysts use DAX measures and scenario analysis to replace manual spreadsheets.
2. How does it improve Power BI budgeting and forecasting?
A Power BI budgeting and forecasting model uses driver-based planning to link projections to operational inputs. By utilizing what-if parameters, finance teams run scenario analysis instantly. This creates a dynamic financial planning and analysis dashboard that improves accuracy and speeds up reporting.
3. Why use DAX measures in finance?
DAX measures are essential for FP&A Power BI because they calculate complex KPIs like variance analysis and rolling forecasts dynamically. Unlike Excel, these formulas are central and reusable, ensuring your financial planning and analysis dashboard remains consistent across every board report and entity.
4. What are calculation groups in finance models?
In an FP&A Power BI model, calculation groups allow you to apply specific logic across multiple DAX measures. This is vital for Power BI budgeting and forecasting, enabling side-by-side scenario analysis and currency conversion without cluttering your data model or your visuals.
5. How does ERP integration help financial planning?
ERP integration ensures your FP&A Power BI model pulls live data directly from the source system. This eliminates manual exports, reduces errors in your financial planning and analysis dashboard, and provides the planning visibility needed for continuous, real-time Power BI budgeting and forecasting.

