

Companies invest millions in Dynamics 365 analytics yet still run their businesses on static spreadsheets. We call this the Data Paradox. You cannot use these tools if your D365 reporting relies on manual data entry.
Automation reduces work by 80%. Still, finance teams waste the first week of every month reconciling figures. This setup creates a massive problem. You can’t see issues until the month ends. That is too late.
Netscape’s James Barksdale said it best. “If we have data, let’s look at data.” Without fast D365 reporting, you make decisions based on opinions.
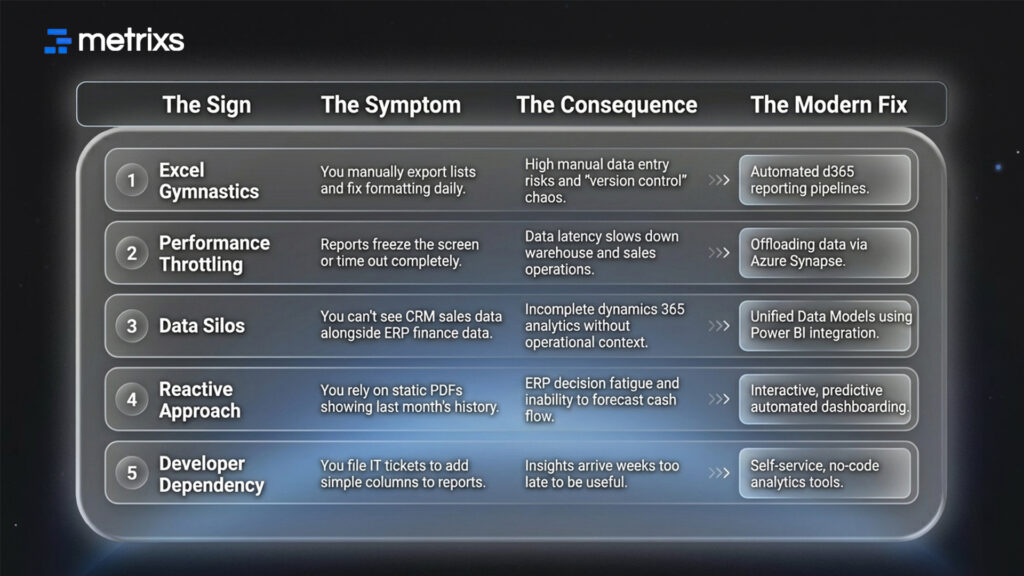
Sign #1: You Are Suffering from “Excel Gymnastics”
You likely know the drill. You need answers, so you export a list, open a spreadsheet, and start fixing formatting errors. This reliance on external tools signals that your D365 reporting strategy fails you.
1. The “Version Control” Nightmare
We see this often. A sales manager pulls data on Monday. The finance director pulls it on Tuesday. By Wednesday, three different managers have three different spreadsheets saved to their desktops. One file is named “Q3_Final,” and another is “Q3_Final_v2.”
This creates a “version control” disaster. You lose the single source of truth. You waste time arguing about whose numbers are correct instead of fixing business problems. Efficient D365 reporting eliminates this confusion. It keeps everyone on the same live view. Without centralized ERP data visualization, teams operate in silos.
2. The Hidden Cost of Manual Labor
Your analysts should analyze strategy, not clean rows. The manual data entry risks are high here. Recent data suggests humans make significant errors when manually processing thousands of rows for financial reporting in Dynamics. You pay your team to think, but they spend hours acting as data janitors.
If your team spends more time preparing data than using it, you have a bottleneck. This manual workload usually points to a deeper issue with your D365 reporting. It stops you from leveraging true Dynamics 365 analytics. A modern D365 reporting setup automates this grunt work so you can focus on growth.
Next, let’s look at why your system slows down when you try to pull this data.
Sign #2: You Experience Performance Throttling
Reports should not crash your system. If you click “generate” and the screen freezes, your architecture is outdated. Slow load times often mean your D365 reporting setup relies on direct queries that strain the ERP.
1. The 10,000 Record Ceiling
Many setups use OData for reporting. This protocol handles small transactions well. It fails at volume. It is not built for heavy reading. When you try to pull a full year of history from Dynamics 365 Finance and Operations, you hit a performance wall.
This leads to OData throttling. The request times out. Worse, it consumes the same resources your warehouse team uses. Your report slows down their scanning devices. Effective D365 reporting must never block daily operations.
2. The Modern Fix
You need to separate reporting traffic from transactional work. Modern architectures move data to a dedicated space first. We often discuss BYOD vs Azure Synapse for this.
Synapse is the modern standard. It handles large datasets instantly. This allows you to run complex Dynamics 365 analytics without lag. Upgrading your D365 reporting infrastructure ensures you get data fast without freezing the business.
Now that we solved the speed issue, we need to address where that data lives.
Sign #3: Your Data Is Siloed from the Rest of the Business
Your ERP data lives in a vacuum. It knows the financial results, but it doesn’t talk to your CRM or marketing platforms. This isolation creates a blind spot. Your D365 reporting tells you what happened, but it rarely explains why.
1. The Missing Context
Consider this example. Your report shows revenue dropped 10% last month. You see the number, but you don’t know the cause. Did sales calls decrease? Did web traffic drop? To find out, you have to open three different browser tabs.
A modern setup fixes this. It uses Power BI integration to merge these streams. You can view Dynamics 365 analytics alongside your sales data in one place. If you have to manually correlate spreadsheets to answer simple questions, your D365 reporting is failing you.
2. The Integration Gap
We see this disconnect often in Business Central reporting and larger operations. You operate with half the picture. Unified data allows you to see the relationship between marketing spend and final profit. This clarity prevents ERP decision fatigue. You stop guessing and start knowing.
Data integration is vital, but seeing the future matters even more.
Sign #4: You Are Reactive, Not Proactive
Most standard D365 reporting shows you what happened last month. This is like driving a car while looking only at the rearview mirror. You see the road behind you perfectly, but you hit the pothole in front of you.
1. The Lack of Predictive Capability
Historical data is not enough anymore. In 2025, your reports must look forward. A static report tells you inventory is low. A smart system predicts exactly when it will run out based on current sales speed.
If your setup lacks these basic forecasting features, you are falling behind. Competitors effectively use Dynamics 365 Analytics to predict cash flow issues before they happen. They fix problems while you are still waiting for the month-end close.
2. Static PDFs vs. Interactive Dashboards
We still see companies emailing PDF reports. A PDF is a dead document. You cannot ask it questions. If you see a cost variance, you have to email someone to investigate.
You need automated dashboarding. This allows you to click on a number and drill down immediately to the transaction level. You spot the outlier instantly. Agile D365 reporting transforms data from a history lesson into a tool for immediate action. If your D365 reporting is static, you stay reactive.
Agility is impossible if you need a developer for every change.
Sign #5: You Rely Heavily on Developer Support
If every minor change to your D365 reporting requires a developer, you have a problem. You should not need to file a support ticket just to add a “Margin %” column to a sales view.
1. The “Ticket Queue” Bottleneck
The process is usually painful. The VP of Sales requests a change. You send it to IT. A developer picks it up next week. By the time the updated report arrives, the business question is irrelevant. This delay kills agility.
2. The Self-Service Standard
Modern data strategy empowers business users. Tools enabled by Power BI integration allow your team to create their own views without writing code. You drag and drop the fields you need.
Your team understands the data best. They should control how they view it. True dynamics 365 analytics means democratizing access. If you rely on code for basic tweaks, your D365 reporting creates a dependency that slows down the entire company.
5 Signs Your D365 Reporting is Obsolete At a Glance:
How Metrixs Can Help You Modernize
Metrixs delivers the world’s most advanced analytics and reporting insights specifically for Microsoft Dynamics 365 Finance & Operations. As a product of Veratas, it helps enterprises consolidate data seamlessly. It transforms raw ERP numbers into a unified view of D365 reporting performance across finance, inventory, and operations.
With a comprehensive library of 1,000+ metrics and 100+ pre-built reports, Metrixs enables 80% faster D365 reporting and 99.9% data accuracy. It eliminates manual inconsistencies and siloed data. This ensures your ERP serves as a growth engine rather than just a data collector.
Key Strengths:
- Rapid Integration: Get up and running in under six weeks with a seamless D365 reporting implementation that minimizes business disruption.
- On-Demand Data Snapshots: Instantly capture historical trends, workforce shifts, and inventory flows for proactive Dynamics 365 analytics decision-making.
- Multi-Region Flexibility: Effortlessly track multiple currencies and units of measurement. This ensures consistent D365 reporting across global locations.
- Centralized Financial Oversight: Automate balance sheets and financial summaries to reduce manual work and maintain a real-time view of your data.
- Measurable Impact: Smart insights help reduce operational costs by 15% and optimize resource allocation within your strategy.
Metrixs turn data into a competitive advantage. It provides the clarity and speed businesses need to scale efficiently. Explore how Metrixs ensures you use your ERP to its full advantage and simplifies d365 reporting → Metrixs.
Conclusion
Running a modern business on manual exports creates a massive drag on operations. You face constant delays, and your data never seems to match up across departments. Relying on manual data entry risks slowing you down exactly when you need speed.
If you ignore these signs, the gap between you and your competitors widens. They use advanced Dynamics 365 analytics to move fast while you get stuck fixing spreadsheet errors. You risk making critical decisions based on old information while the market shifts. This data latency turns your ERP from an asset into a liability.
You need a system that works as hard as you do. Metrixs modernizes your D365 reporting by connecting your data and automating the heavy lifting. We remove the bottlenecks so you focus on strategy. Stop driving with a foggy windshield.
Contact Metrixs today for a complimentary “Reporting Maturity Assessment” and see how fast your data can really move.
FAQs
1. Why is my Dynamics 365 reporting so slow?
Slowness often stems from OData throttling when querying Dynamics 365 Finance and Operations directly. This creates high data latency and frustrates users. To fix this, we recommend offloading data to Azure Synapse. This approach ensures your D365 reporting runs instantly without freezing your system or causing unnecessary ERP decision fatigue.
2. Is Power BI included with Dynamics 365?
While you get basic embedded charts, robust ERP data visualization typically requires separate licenses like Power BI Pro. This investment unlocks full Power BI integration, allowing you to share custom D365 reporting dashboards globally. It empowers your team to move beyond static lists and finally embrace true automated dashboarding.
3. What is the difference between BYOD and Azure Synapse Link?
When comparing BYOD vs. Azure Synapse, BYOD is the legacy option requiring constant manual upkeep. Synapse Link is the modern choice for Dynamics 365 analytics, offering faster syncs and lower costs. It future-proofs your D365 reporting, handling massive data volumes without the technical debt associated with older SQL exports.
4. Can I automate my monthly financial reports in D365?
Absolutely. You can eliminate manual data entry risks by using Power Automate to schedule delivery. This setup ensures financial reporting in Dynamics arrives in your inbox automatically every month. It streamlines your closing process, keeping your D365 reporting accurate while saving your finance team days of repetitive administrative work.
5. How do I combine CRM and ERP data in one report?
Standard Business Central reporting often isolates data in silos. To fix this, use a unified model that merges D365 reporting figures with CRM insights. This integration supports holistic dynamics 365 analytics, allowing you to track sales performance against operational costs in one view. You get a complete picture without opening multiple tabs.

