

Cash flow blindness kills businesses. Statistics show 82% of companies fail because they lack a solid cash flow analysis. Entrepreneurs often obsess over profit margins. Most failures stem from poor cash management.
You might look profitable on a financial statement. You could still be broke. This happens when your working capital management fails. New data shows 81% of firms face payment delays.
This gap makes a liquidity analysis necessary for survival. This guide shows you how to check your “fuel tank.” Use this cash flow analysis to turn raw data into a strong business cash position.
The Fundamentals: Operating, Investing, and Financing Activities
Every dollar your company moves belongs to one of three categories. You must know these categories to master a cash flow analysis. Categorizing these movements helps you understand your true business cash position.
Use a cash flow analysis to see the truth behind the numbers. A cash flow analysis helps you make better choices.
1. Operating Activities: This represents your daily engine. Your operating cash flow tracks money from sales and services. It shows if your core business actually makes money. Without a strong operating cash flow, your business relies on luck.
2. Investing Activities: This section covers your future growth. It includes capital expenditures like buying machines or property. High spending here might mean you are scaling up. Always track these cash inflows and outflows to see where your money goes.
3. Financing Activities: This shows how you fund the business. It includes debt, equity, and dividends. If you take a loan, it shows up here. This part of your financial statement reveals your capital structure. A cash flow analysis tracks these shifts.
Profit doesn’t equal cash. You might look great on paper but have an empty bank account. If your accounts receivable are full of unpaid invoices, your working capital management is failing. You cannot pay your staff with “projected” revenue. You need a liquidity analysis to find the gaps.
A thorough cash flow analysis reveals if your growth is self-sustaining. If your accounts payable grow too fast, you might face trouble. Proper working capital management keeps these balanced. Use a cash flow analysis to stay ahead.
Now that you understand the pillars, you need a repeatable process to track them.
A Practical Framework for Effective Cash Flow Analysis
You need a repeatable process to manage your money. This framework turns a static financial statement into a roadmap. Use these steps to perform a cash flow analysis that protects your business cash position.
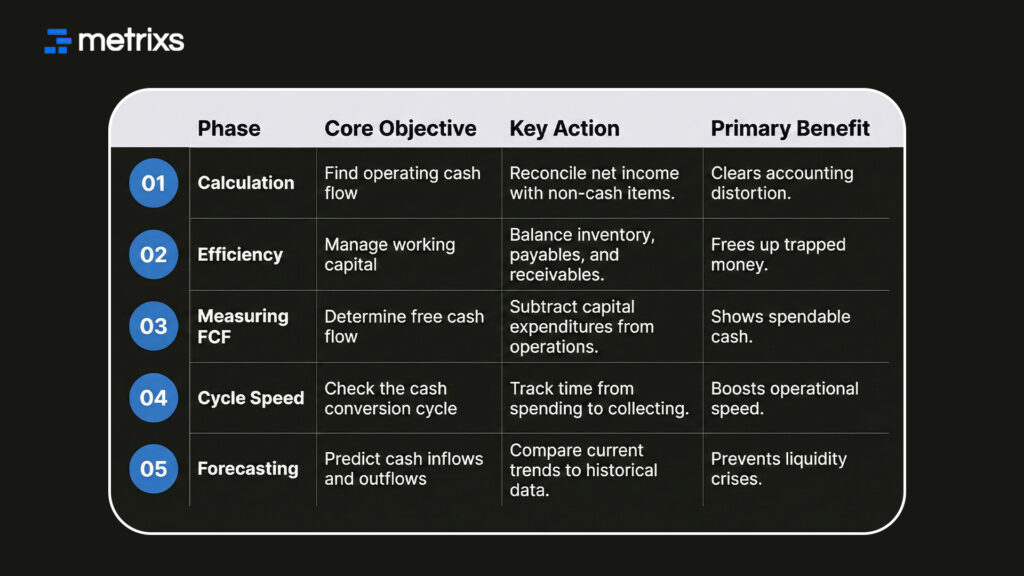
Phase 1: Calculation and Reconciliation
Start with the indirect method. This reconciles net income to find your operating cash flow. You must add back non-cash costs like depreciation because they don’t actually leave your bank account.
Use this cash flow analysis formula: Operating Cash Flow = Net Income + Depreciation and Amortization + Change in Working Capital.
A thorough cash flow analysis ensures you don’t overlook these non-cash adjustments that distort your reality.
Phase 2: Evaluate Working Capital Efficiency
Your working capital dictates daily operations. Track how inventory and accounts payable affect your balance.
- Inventory: Buying too much stock ties up your cash.
- Accounts Payable: Extending these payments lets you keep cash longer.
- Accounts Receivable: If customers don’t pay fast, your cash flow analysis will show a deficit despite high sales.
Smart working capital management keeps these three parts balanced so you never run dry.
Phase 3: Measure Free Cash Flow (FCF)
Free cash flow is what remains after you pay for assets. It is the gold standard of a liquidity analysis.
Use the formula: Free Cash Flow = Operating Cash Flow – Capital Expenditures.
Investors look for high free cash flow because it funds dividends and debt payments. You must subtract your capital expenditures to see what is truly left to spend.
Phase 4: The Cash Conversion Cycle (CCC)
The cash conversion cycle tracks speed. It shows how long it takes to turn a dollar spent into a dollar collected.
Use the formula: CCC = Days Inventory Outstanding + Days Sales Outstanding – Days Payable Outstanding.
A low cash conversion cycle means your business is efficient. High cycles mean your working capital management needs a complete overhaul.
Phase 5: Trend and Forecast
Compare current cash inflows and outflows against past months. This helps you spot seasonal dry spells before they happen. Regular cash flow analysis makes forecasting accurate. It allows you to adjust spending before a crisis hits.
Quick Glance: A Practical Framework for Effective Cash Flow Analysis
Running these numbers manually is slow and leads to mistakes.
Optimizing Cash Visibility with Metrixs for Microsoft Dynamics 365
Manual spreadsheets jeopardize your business cash position. Metrixs delivers advanced analytics for Microsoft Dynamics 365 Finance & Operations. We transform raw ERP numbers into a unified view of your cash flow analysis.
- Rapid Integration: Start in under six weeks to improve your working capital management without business disruption.
- Accuracy: Replace siloed data with a library of 1,000+ metrics. This enables 80% faster cash flow analysis with 99.9% data accuracy.
- Global Flexibility: Effortlessly track multiple currencies to ensure consistent liquidity analysis across global locations.
- Data Snapshots: Instantly capture historical trends and inventory flows to identify where money stays trapped.
- Measurable Impact: Automated financial summaries help reduce operational costs by 15% and protect your free cash flow.
Metrixs turn your ERP into a growth engine. We provide the clarity you need to optimize your cash conversion cycle and scale efficiently.
Conclusion
Cash flow analysis tracks the actual movement of money in your business. It confirms you have enough operating cash flow for daily costs. Many leaders struggle with manual data and siloed reports. These issues ruin your working capital management.
A single error in your financial statement leads to bad results. Wrong data triggers missed payroll or sudden insolvency. You might believe your free cash flow is healthy. Your bank account is actually empty. This lack of visibility ends companies.
Metrixs for Microsoft Dynamics 365 solves this by automating your cash flow analysis. We provide a clear view of your business cash position. Accurate cash flow analysis ensures you base your growth on facts.
Frequently Asked Questions
1. What is the direct method for a cash flow analysis?
The direct method totals actual cash inflows and outflows from operations. It tracks accounts receivable collections and accounts payable payments directly. This provides a clear business cash position but requires more detail than reconciling a standard financial statement from net income.
2. How do I improve my cash conversion cycle?
Shorten your cash conversion cycle by accelerating accounts receivable collections and optimizing inventory. Effective working capital management ensures you do not trap money in slow-moving stock. Faster cycles improve your liquidity analysis and increase the operating cash flow available for growth.
3. Why is free cash flow better than net income?
Net income shows accounting profit, but free cash flow shows actual spendable money. After accounting for capital expenditures, FCF reveals your true business cash position. Use a cash flow analysis to ensure your working capital management supports long-term operational health.
4. How does Metrixs improve a cash flow analysis?
Metrixs automates data from Microsoft Dynamics 365 to provide a real-time cash flow analysis. It eliminates manual errors in your financial statement and identifies trapped working capital. This results in 99.9% accuracy for your liquidity analysis and faster financial reporting.
5. Can a business have profit but no operating cash flow?
Yes. High sales on your financial statement do not equal money in the bank. If your working capital management is poor, cash stays stuck in accounts receivable. A regular cash flow analysis helps you monitor these cash inflows and outflows.

