
Your sales team needs instant pipeline visibility. Finance wants real-time budget tracking. Operations demand live performance metrics. Static reports don’t cut it anymore.
Microsoft Dynamics 365 delivers real-time data visualization through native dashboards plus Power BI embedded dashboards. Organizations report faster decisions and better operational visibility across departments.
Native Dynamics 365 dashboard building handles simple metrics. Power BI integration manages complex analysis. Smart teams combine both approaches.
This guide explains metric selection, dashboard configuration, performance optimization, and adoption strategies. You’ll learn which method fits your needs and how to implement it correctly. Metrixs helps organizations design and deploy live dashboard solutions optimized for Microsoft Dynamics 365 environments.
Step 1: Define Metrics Before Building Anything
Real-time data visualization fails without proper metric selection. Start with business questions that need answers, not fancy graphics.
1. Start With the Real Business Questions
Sales teams track pipeline velocity and conversion rates. Finance monitors cash flow forecasts. Service departments measure resolution times and customer sentiment. Dynamics 365 dashboard building starts with clear KPI definitions for each role.
2. Keep Dashboards Action Focused
Cut the noise. One organization reduced load time from 27 seconds to 10 seconds by removing excess visuals. Power BI embedded dashboards perform better with 3-5 key visualizations maximum. Focus on metrics where updates actually improve decisions.
3. Identify Data Sources Inside Dynamics 365
Customer Engagement pulls Sales, Service, and Marketing data. Finance and Operations connects General Ledger and Supply Chain. Microsoft Dynamics 365 uses Dataverse for model-driven apps or Entity store for F&O environments.
Clear metrics plus identified sources set the foundation. Now choose your dashboard method based on complexity requirements.
Step 2: Choose Your Dashboard Method
Microsoft Dynamics 365 offers two dashboard approaches. Native dashboards handle simple operational tracking. Power BI integration manages complex cross-departmental analysis. Your choice depends on data complexity and user requirements.
1. Native Dynamics 365 Dashboards
Best for simple, entity-level metrics. User dashboards support 6 visuals maximum, displaying funnels, bar graphs, and pie charts. System dashboards require administrator creation. Dynamics 365 dashboard building auto-refreshes without additional licensing.
Perfect for day-to-day activities:
- Open opportunities tracking
- Renewal monitoring
- Service case volumes
- Limited to Dynamics 365 reporting tools data only
- No Power BI license required
2. Power BI Embedded Dashboards
Best for multi-source analysis and advanced KPIs. Power BI embedded dashboards handle thousands of records without performance lag. Support unlimited visualizations combining multiple Microsoft Dynamics 365 modules plus external sources.
Key requirements and features:
- Power BI Pro ($10/user/month) or Premium ($20/user/month) licensing
- AI-powered insights and predictive analytics
- Interactive KPI visualization capabilities
- Share dashboards with Office 365 users beyond Dynamics access
3. When to Use a Hybrid Approach
Sales reps use native dashboards for daily pipeline tracking. Managers access Power BI embedded dashboards for performance trends. Executives view strategic KPIs combining multiple data sources. Real-time dashboards work best when matching tool capabilities to user needs.
Optimize costs through selective deployment. Your dashboard method determines implementation steps and performance optimization strategies.
Step 3: Build Your Dashboard Step by Step
Power BI integration requires proper environment configuration before dashboard creation. Follow these implementation steps for embedded analytics success.
1. Enable Power BI Inside Dynamics 365
Navigate to Settings > Administration > System Settings > Reporting tab. Enable the “Allow Power BI visualization embedding” option. Configure Power BI visualization embedding in Power Platform Admin Center. Connect to the Power BI workspace using OAuth2 authentication.
Confirm the same Microsoft Entra domain for both environments. Verify workspace permission requirements before proceeding.
2. Create Live Visuals in Power BI
Design KPI cards showing real-time data visualization. Use Direct Query mode for true live data instead of Import mode. Optimize datasets including only necessary tables and columns. Configure appropriate refresh intervals, balancing freshness with performance.
3. Embed the Dashboard into Dynamics 365
Navigate to Dashboards > New > Power BI embedded. Enter a display name and select a workspace. Choose your published Power BI dashboard from the dropdown. Enable unified clients for mobile access. Users drill into reports without leaving Microsoft Dynamics 365, eliminating tool switching.
Proper embedding ensures seamless live data streaming across your organization. Next, optimize refresh performance and user access controls.
Step 4: Set Up Real-Time Refresh and Performance Optimization
Real-time dashboards demand proper refresh configuration and performance tuning. Balance data freshness against system resources for optimal user experience.
1. Choose the Right Refresh Frequency
Streaming datasets support a maximum of 200,000 rows and 120 API requests per minute. Sales performance monitoring dashboards refresh every 5-15 minutes, balancing insight with performance. Executive KPIs refresh hourly. Customer churn metrics warrant 10-30 second continuous intervals.
Match refresh rates to actionability. DirectQuery eliminates scheduled refresh entirely for true live data streaming.
2. Improve Speed and Reliability
Limit dashboards to 3-5 visualizations. Optimize queries, avoiding expensive DAX calculations. Incremental refresh reduces data warehouse load significantly. Add indexing on frequently queried Microsoft Dynamics 365 fields.
Gateway infrastructure matters—proper placement reduces latency by 50 ms. Use Performance Analyzer to identify slow visuals.
3. Apply Role-Based Access Control
Configure visibility for sales reps, managers, and leadership. Embedded analytics respect Dynamics security roles, presenting only relevant content. Implement row-level security matching business units and territories.
Proper optimization ensures consistent performance metrics tracking without system degradation. Strong access controls protect sensitive business data.
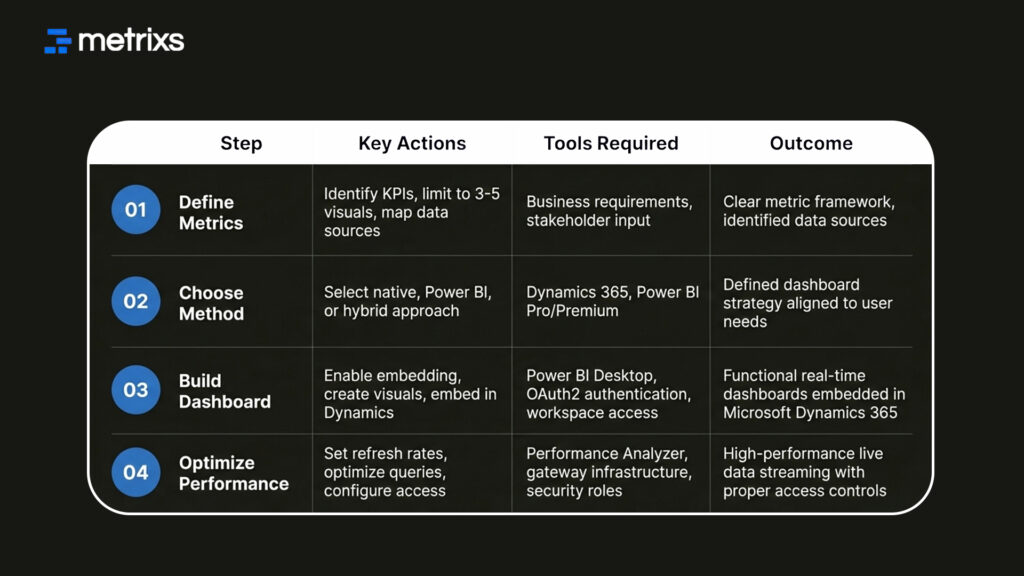
Quick Reference: Dashboard Implementation Steps
How Metrixs Helps Teams Build Live Dashboards
Metrixs delivers advanced analytics and reporting insights specifically for Microsoft Dynamics 365 Finance & Operations. It helps enterprises consolidate data seamlessly, transforming raw ERP numbers into unified real-time dashboards across finance, inventory, and operations.
With a comprehensive library of 1,000+ metrics and 100+ pre-built reports, Metrixs enables 80% faster dashboard creation and 99.9% data accuracy. It eliminates manual inconsistencies and siloed data, ensuring your ERP serves as a growth engine.
Our Key Strengths:
- Rapid Integration: Get up and running in under six weeks with seamless Power BI embedded dashboards implementation that minimizes business disruption.
- On-Demand Data Snapshots: Instantly capture historical trends and operational flows for proactive business intelligence and embedded decision-making.
- Multi-Region Flexibility: Effortlessly track multiple currencies and units of measurement, ensuring consistent Dynamics 365 reporting tools across global locations.
- Centralized Financial Oversight: Automate balance sheets and financial summaries, maintaining real-time data visualization of performance metrics.
- Measurable Impact: Smart insights help reduce operational costs by 15% and optimize resource allocation within your live data streaming strategy.
Metrixs turn data into a competitive advantage, providing the clarity and speed businesses need for efficient sales performance monitoring. Explore how Metrixs simplifies interactive KPI visualization → Metrixs.
Conclusion
Real-time dashboards became business necessities in 2025, where decision velocity determines competitive advantage. Organizations implementing proper Microsoft Dynamics 365 dashboard architecture report measurable improvements in response times and data-driven decision-making.
Success requires careful metric selection, appropriate technology choice between native and Power BI embedded dashboards, thoughtful performance optimization, and strong user engagement. Investment in live data streaming infrastructure delivers returns through faster insights and improved collaboration.
Metrixs designs and implements optimized dashboard solutions for Microsoft Dynamics 365 environments, helping organizations achieve faster reporting and complete operational visibility.
Connect with Metrixs to streamline your Dynamics 365 dashboard implementation.
FAQs
1. What’s the difference between native Dynamics 365 dashboards and Power BI embedded dashboards?
Native Dynamics 365 dashboards work with single entities and update automatically without Power BI integration. They support 6 visuals maximum for quick sales performance monitoring. Power BI embedded dashboards handle complex multi-source consolidation with unlimited interactive KPI visualization, requiring Power BI licensing for advanced business intelligence embedded capabilities.
2. How often should dashboards refresh in real time?
Sales performance monitoring dashboards refresh every 5-15 minutes, balancing real-time data visualization with system performance. Executive KPIs refresh hourly. Time-sensitive metrics like customer churn warrant continuous 10-30 second live data streaming intervals. Match dashboard refresh rates to actionability. If metrics update daily, a daily refresh suffices for optimal performance metrics tracking.
3. Can I embed Power BI dashboards directly into Dynamics 365?
Yes. Enable Power BI visualization embedding in System Settings. Connect the Power BI workspace to Microsoft Dynamics 365 using OAuth2 authentication. Design your dashboard, then embed it within the Dynamics 365 dashboard building interface by selecting the published dashboard. Real-time dashboards appear with live data streaming, eliminating system switching and improving embedded analytics adoption rates.
4. How do I handle dashboard performance when dealing with large datasets?
Optimize by aggregating data in Power BI datasets rather than querying raw tables. Limit dashboards to 3-5 visualizations. Use filters for drill-down instead of loading all details. Index frequently queried Microsoft Dynamics 365 fields. Consider incremental refresh loading only recent changes, significantly improving performance metrics tracking and reducing system strain for real-time data visualization.
5. What’s the best way to ensure dashboard adoption across my team?
Adoption thrives when real-time dashboards answer real business questions fitting existing workflows. Involve users in design, and iterate based on feedback. Make Power BI embedded dashboards accessible without leaving Microsoft Dynamics 365. Provide role-tailored training: executives get strategic interactive KPI visualization, managers get team performance metrics tracking, and contributors get operational metrics. Celebrate wins where Dynamics 365 dashboard building changed decisions.
6. Should we use continuous real-time refresh or scheduled refresh?
Continuous refresh (10-30 second intervals) suits time-critical metrics like sales performance monitoring or customer escalations. Scheduled refresh (hourly/daily) works for stable metrics like forecasts. Live data streaming consumes more resources. Start scheduled, and upgrade to continuous only where real-time data visualization measurably improves decisions. Monitor system performance. Excessive dashboard refresh rates degrade Microsoft Dynamics 365 database load.

