

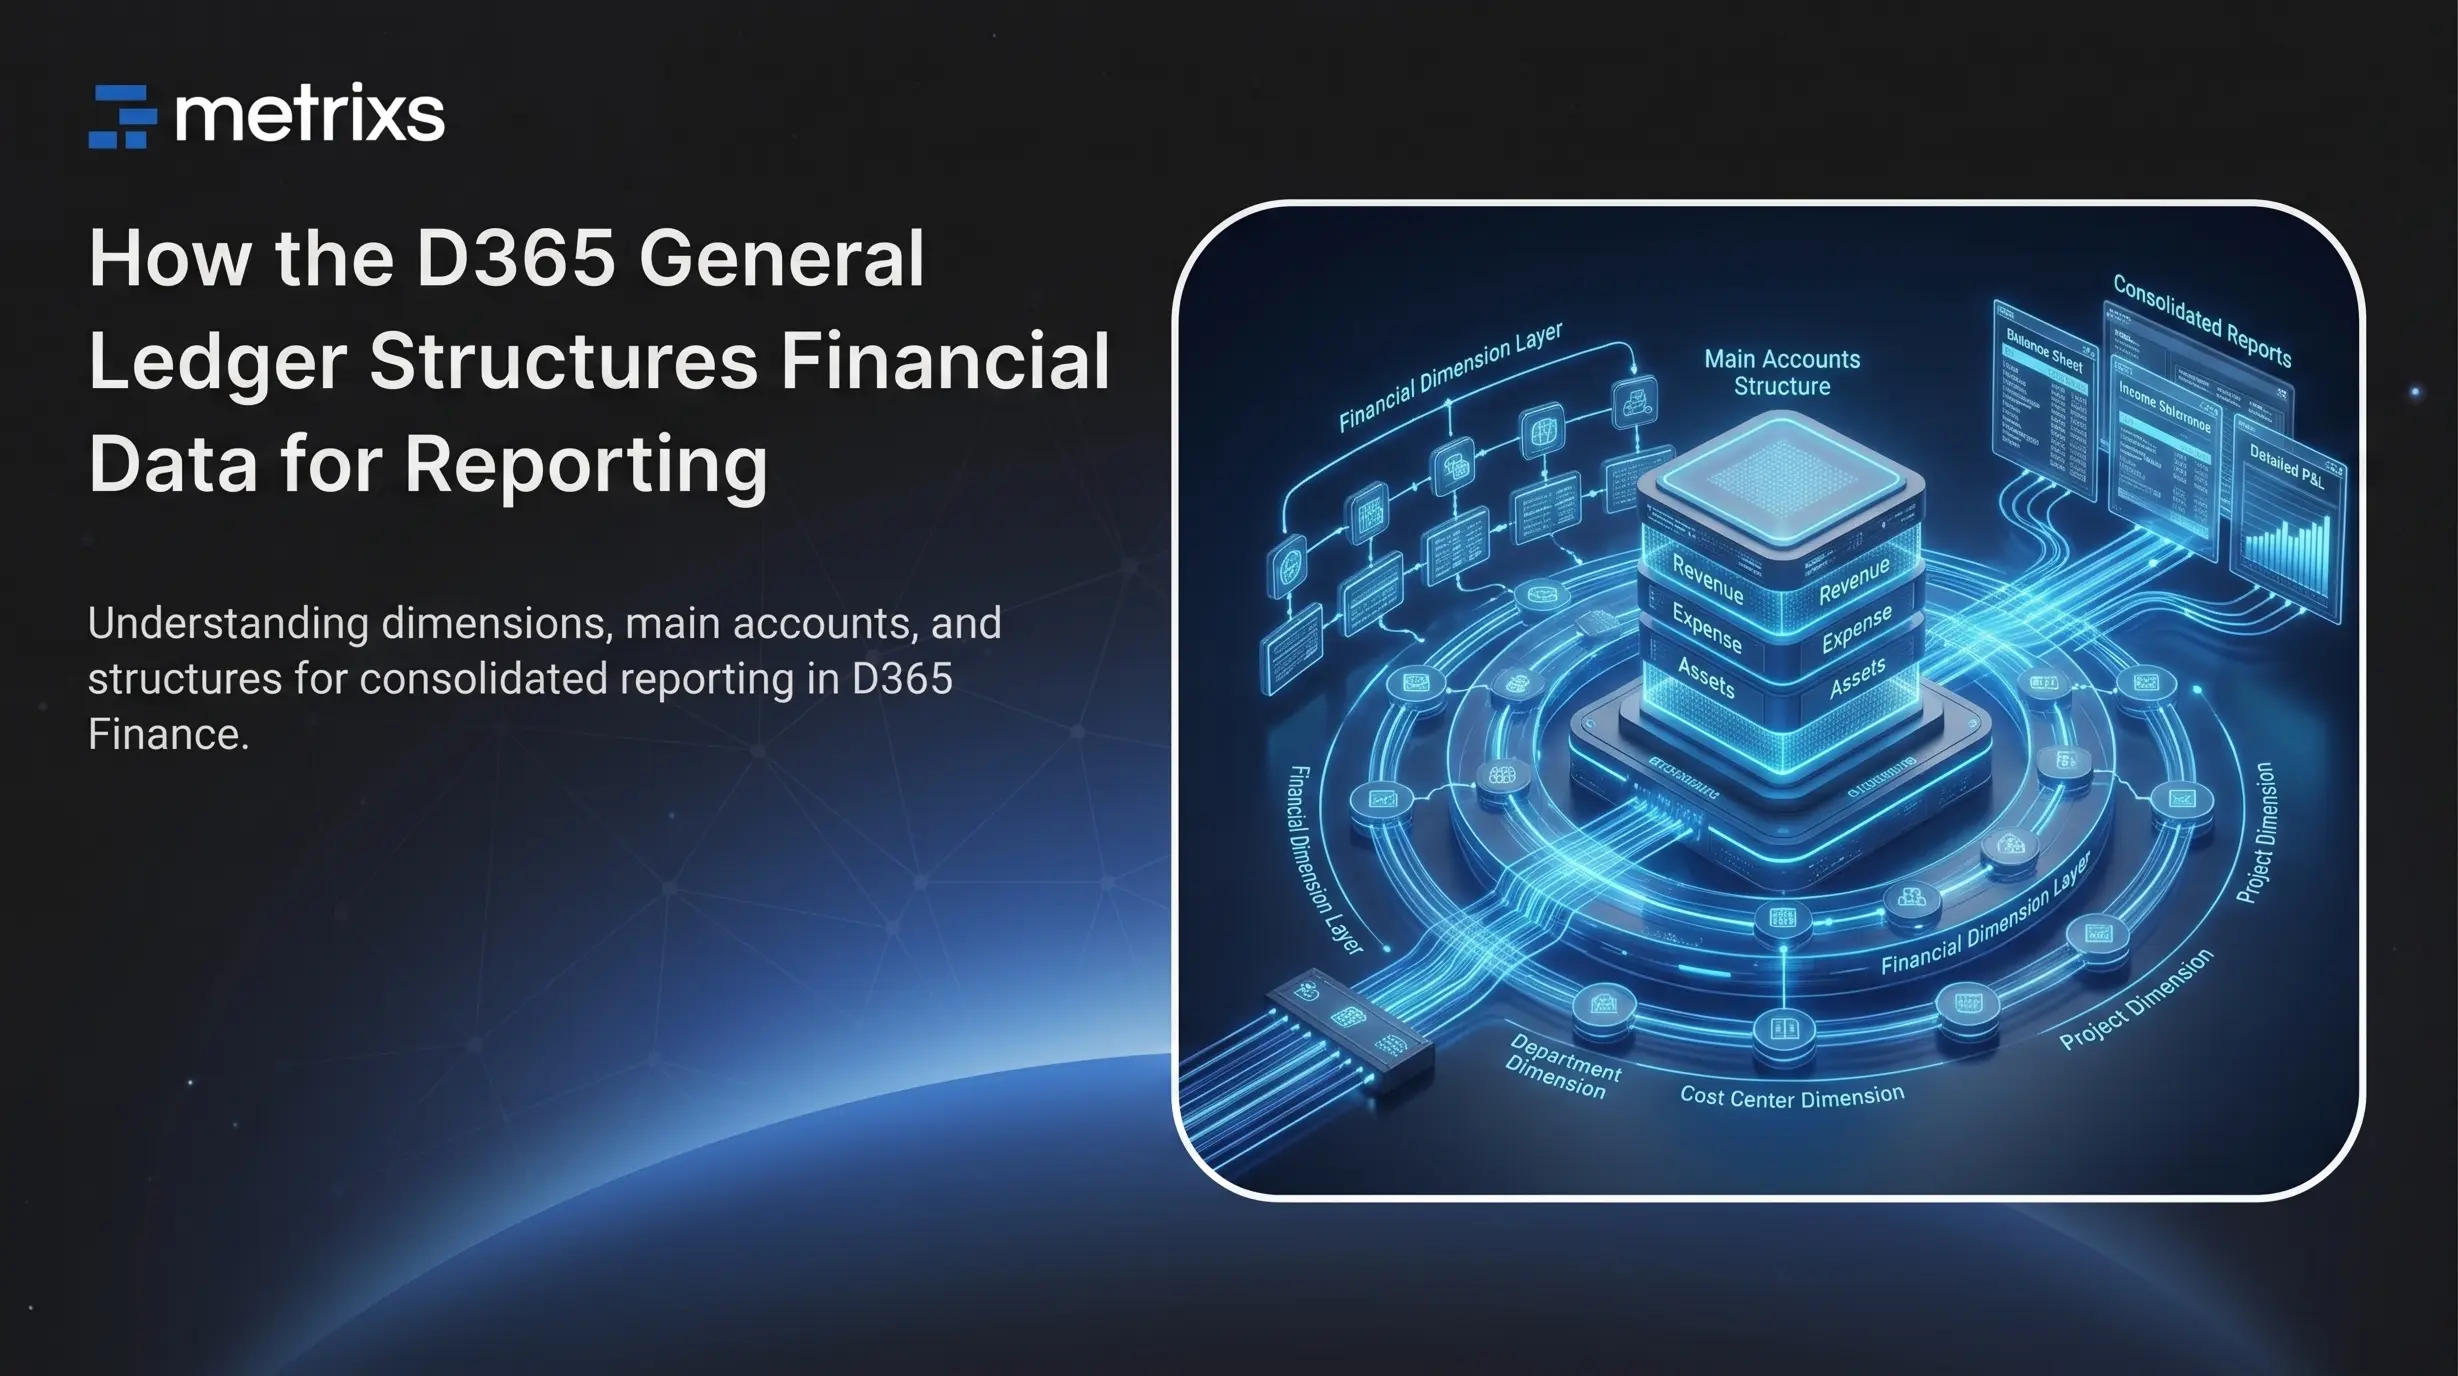
Every number your finance team reports to leadership, from the trial balance to the board deck, starts as a single posted line in the D365 General Ledger. Get the structure behind that ledger right, and reporting is fast and repeatable. Misread it, or simply not understand it, and month-end close turns into a manual reconciliation exercise every time.
Dynamics 365 Finance and Operations holds 6,000 backend tables, and the D365 General Ledger touches a large share of them: main accounts, financial dimensions, posting layers, and fiscal periods all combine before a single balance shows up on a report. This guide will explain how the D365 General Ledger structures financial data, piece by piece, and where that structure helps or blocks general ledger reporting.
What the General Ledger does in D365 F&O
The D365 General Ledger is the system of record for every posted financial transaction in Dynamics 365 Finance and Operations. Every subledger eventually settles here, which is what makes it the base for both compliance and management reporting. A few rules govern how that happens:
- One ledger per legal entity: multi-entity organizations run a separate ledger for each entity, each with its own chart of accounts, currency, and fiscal calendar.
- Subledgers post summarized detail: accounts payable, accounts receivable, fixed assets, inventory, and projects each keep their own detail, then summarize into the general ledger as ledger transactions rather than duplicating every line.
- Every posting is a balanced voucher: a paired set of debit and credit entries that must net to zero before D365 F&O allows it to post.
That last rule, that a voucher must balance, is what keeps the D365 General Ledger reliable enough to report from directly, module after module, without reconciling side systems back to it.
The building blocks that structure financial data
Four structural elements combine to shape how financial data moves through the D365 General Ledger: the chart of accounts, financial dimensions, account structures, and the fiscal calendar. Each one narrows what a posting can look like before it reaches the ledger.
Chart of accounts and main accounts
The chart of accounts is the list of main accounts a legal entity can post to, and each main account carries a type that decides where it lands on financial statements and whether its balance carries forward or resets at year-end. The main types split into two groups:
- Balance sheet accounts: asset, liability, and equity accounts, which carry a balance forward into the next fiscal year.
- Profit and loss accounts: revenue and expense accounts, which reset to zero at year-end once their result posts to retained earnings.
D365 F&O also supports account categories for grouping similar accounts, and multiple entities can share one chart of accounts or run entity-specific charts, depending on how centralized the organization’s finance function is.
Financial dimensions
Financial dimensions add the analytical layer on top of the chart of accounts. Default dimensions such as cost center, department, business unit, and site come standard, and D365 F&O supports custom financial dimensions for anything specific to the business, such as project, region, or brand.
Every ledger transaction carries a combination of a main account and its financial dimensions, which is what lets finance slice a single expense account by department or region without maintaining separate accounts for each combination.
Account structures
An account structure defines which financial dimension values are valid for a given main account, and in what order they combine. Each structure can hold up to 11 segments, one main account plus up to 10 additional financial dimensions, and D365 F&O validates every posting against that structure before it reaches the ledger, which is what stops a cost center from being paired with an account it was never meant to touch.
Advanced rule structures extend this further, pushing the ceiling to 16 total segments and applying conditional logic so specific dimension combinations are allowed, blocked, or defaulted depending on the account involved.
Fiscal calendars and periods
A fiscal calendar defines the year and the periods inside it, and every ledger transaction posts against one of those periods. Each period carries one of three statuses:
- Open: postings are accepted from anyone with access to that period.
- On hold: postings are blocked, but the period can be reopened later if a correction is needed, which is the recommended state right after a close.
- Permanently closed: postings are blocked for good, with no way to reopen the period, so it is reserved for periods well outside any audit window.
This graduated control is what lets finance run a clean month-end close: once a period moves to On hold, the numbers behind it stop moving, and any correction happens through a deliberate reopening rather than a silent edit.
Want to see how your own chart of accounts and financial dimensions translate into ready-made reports, instead of a spreadsheet project? Take a look at the Metrixs analytics suite built for D365 F&O.
How the GL stores that data behind the scenes
Underneath the chart of accounts and financial dimensions sits a small set of tables that do the actual work:
- GeneralJournalEntry stores the voucher header, one row per transaction.
- GeneralJournalAccountEntry stores each posted line inside that voucher, the actual ledger transactions with their account, dimension combination, and amount.
- DimensionAttributeValueCombination resolves the ledger dimension, so every ledger transaction can reference a single ID instead of repeating the full account and dimension string.
That indirection keeps the ledger compact, but it also means a report cannot read account and dimension values directly off a transaction table; it has to join back through the combination to make sense of a single line.
D365 F&O actually ships up to 10 posting layers per ledger: current, operations, tax, and up to seven custom layers for parallel accounting standards, though most legal entities only ever populate the first three. Adjustments posted to one layer do not distort another. Ledger balances are then maintained per account, dimension combination, and period, which is how the system derives a point-in-time position without re-summing every historical transaction.
This model is efficient for posting: it validates fast, stores compactly, and scales to high transaction volumes. It is considerably less efficient for reporting, because every report has to reconstruct meaning from IDs, joins, and posting layers that were built for the ledger’s own use, not for a finance analyst’s, which is exactly why the D365 General Ledger needs a separate reporting layer to be genuinely useful at scale.
How the structure maps to financial statements and reporting
Every financial statement the D365 General Ledger produces is really just a different filter over the same ledger balances:
- Balance sheet: totals the asset, liability, and equity accounts at a single point in time.
- Income statement: totals the revenue and expense accounts across a period.
- Trial balance: lists every account and dimension combination with its balance at a given moment, the starting point most of this reporting is built from.
Financial dimension sets narrow that further, letting finance re-run the same trial balance by department, cost center, or region without touching the underlying data. Dimension hierarchies take it a step higher, rolling individual cost centers up into divisions or regions so a report can move between detail and summary without a separate query for each level.
For organizations running D365 F&O across several legal entities, reporting also has to handle consolidation: converting each entity’s ledger into a common currency, applying intercompany eliminations so intercompany balances do not double-count, and presenting one consolidated set of statements alongside each entity’s own.
The last piece is time. A trial balance run today and the same trial balance rerun for last quarter should agree, which means the reporting has to preserve point-in-time balances alongside current ones, so trend and comparative views stay accurate months or years later.
If department-level trial balances and multi-entity consolidation are reports your team rebuilds by hand every month, see how the D365 F&O finance and accounting analytics use case automates that.
Where native D365 F&O reporting runs into limits
Both native paths for reporting sit on top of the D365 General Ledger, and both have real ceilings:
- Financial reporting (built on Management Reporter) produces statutory-quality balance sheets and income statements, but changing a layout, adding a dimension, or building a new comparative view usually means a developer or a power user rebuilding the report definition rather than making a quick edit.
- Embedded Power BI reads from the Entity Store, and most organizations schedule its refresh somewhere between 30 and 60 minutes to avoid straining the production environment (Rand Group). That works for a static dashboard and is too slow for anyone reconciling intraday.
Point-in-time snapshots and multi-year trend lines are harder still, because the ledger stores balances efficiently for the system’s own use, not for a five-year comparative view, so reconstructing that history usually means custom development against the tables described above.
Building that in-house means mapping account structures and financial dimensions across a chunk of D365 F&O’s 6,000 backend tables, which is a multi-month project for most internal teams, not a report. That gap, between what native tools ship and what finance actually needs from general ledger reporting, is exactly where a dedicated analytics layer earns its cost.
| What you need | Native D365 F&O tools | A dedicated layer such as Metrixs |
|---|---|---|
| Editable statutory statements | Rebuild the report definition for each change | Prebuilt, still editable in Power BI |
| Refresh speed | 30 to 60 minutes on the Entity Store | 15 to 30 minutes via Synapse Link |
| Multi-year trend history | Custom development against raw GL tables | Configurable history on your own data lake |
| Multi-entity consolidation | Largely manual once entity count grows | Automated eliminations and rollups |
How Metrixs structures GL data for reporting
Metrixs takes a different starting point. Instead of reporting off the ledger’s own storage model, it reads the raw D365 General Ledger tables through Azure Synapse Link and rebuilds them into clean fact and dimension models in Azure SQL, tables shaped for reporting rather than for posting (Metrixs). The GL module keeps every structure covered above intact:
- Prebuilt statements: balance sheet, income statement, trial balance, period-on-period trend, and point-in-time snapshots ship ready to use.
- Dimensions as slicers: financial dimensions carry through individually instead of flattening into a single field.
- Built-in consolidation: dimension hierarchies and intercompany eliminations mean multi-entity reporting consolidates automatically instead of through a manual spreadsheet tie-out.
- Faster refresh: data refreshes every 15 to 30 minutes through Synapse Link, with Power BI content available in either import or Direct Lake mode.
- Role-aligned security: row-level and object-level security match the roles your team already uses inside D365 F&O.
The GL module is one of 12 analytics modules built on top of the general ledger and the rest of D365 F&O, part of a suite that ships 100+ prebuilt reports and 1,000+ configurable metrics, with most deployments live in under 6 weeks. One manufacturer still running Dynamics AX 2012 used Metrixs to rebuild this kind of reporting without an ERP upgrade, and reported a 310% ROI with a five-month payback.
Curious how your own chart of accounts and financial dimensions would map into the GL module? The Metrixs consulting team can scope that in a single call.
Frequently asked questions
What is the D365 General Ledger?
It is the core module in Dynamics 365 Finance and Operations that records every posted financial transaction for a legal entity. It is the system of record subledgers such as accounts payable and fixed assets post into, and it is the source every financial statement and trial balance is ultimately built from.
What are financial dimensions in D365 F&O?
Financial dimensions are the analytical tags- cost center, department, project, region, or custom values specific to a business- that attach to every ledger transaction alongside its main account. They let finance slice the same account by department or location without maintaining separate accounts for each combination.
What is a chart of accounts in D365 F&O?
A chart of accounts is the list of main accounts a legal entity can post to, each typed as balance sheet or profit and loss. D365 F&O lets multiple entities share one chart of accounts or run their own, and account structures control which financial dimensions each account is allowed to combine with.
How does D365 F&O produce a trial balance and balance sheet?
Both are filtered views of the same ledger balances. A trial balance lists every account and dimension combination with its balance at a point in time, and a balance sheet totals the accounts typed as balance sheet accounts at that same point. Financial dimension sets let either view be re-run by department, region, or cost center.
Which tables store General Ledger transactions in D365 F&O?
Ledger transactions post to GeneralJournalEntry for the voucher header and GeneralJournalAccountEntry for each posted line, with DimensionAttributeValueCombination resolving the main account and financial dimension combination, the ledger dimension, that each line references. Reporting directly off these tables usually means rebuilding those joins yourself, which is why most teams add a separate reporting layer.
How do you report across multiple legal entities in D365 F&O?
Each legal entity in D365 F&O runs its own ledger, chart of accounts, and fiscal calendar, so cross-entity reporting means converting each entity’s balances to a common currency and applying intercompany eliminations before consolidating. Native tools support this, but the process is largely manual once the entity count grows.
Why is general ledger reporting hard to do directly in D365 F&O?
It is hard because the tables behind the D365 General Ledger are optimized for fast, reliable posting, not for ad hoc analysis: dimension values resolve through ID combinations, balances split across posting layers, and history is not stored the way a five-year trend line needs. That gap is what a dedicated analytics layer is built to close.
The verdict
The D365 General Ledger is built to post financial transactions accurately, not to answer every reporting question finance will ever ask, and that is by design. Chart of accounts, financial dimensions, account structures, and fiscal periods give every transaction the structure it needs to post correctly. Turning that same structure into fast, flexible general ledger reporting is a separate job.
Metrixs does that job: keeping every dimension and hierarchy intact, refreshing every 15 to 30 minutes, and shipping the GL module and eleven others in under 6 weeks.
Ready to see what your own D365 General Ledger data looks like once it is reporting-ready? Book a Metrixs reporting assessment, and we will map your chart of accounts and financial dimensions against what the GL module already covers.
Related reading: Using financial dimensions in D365 F&O to slice reports by department, region, and product

