
Power BI use grows as companies demand real-time data. Use bookmarks in power bi to create interactive dashboards that work like apps. These tools turn flat reports into dynamic visuals. Microsoft adds AI to these reports to find trends fast. A bookmark navigator helps guide your team through a story.
This guide shows 20 ways to improve your reporting. You will find these strategies save time. Leaders make better decisions with them. Use bookmarks in power bi to change your data.
A) Core Bookmark Techniques and Navigation Implementation
Setting up bookmarks in power bi requires a solid plan for Power BI navigation. You want your interactive dashboards to feel smooth and responsive. Use these four methods to build a better user experience.
Technique 1. Creating Bookmarks with Selected Visuals and Groups
Mastering bookmarks in power bi starts with bookmark groups. This keeps other parts of your interactive dashboards from resetting when you click a button.
- Select your desired visuals on the canvas.
- Press Ctrl+G to group them.
- In the Bookmarks pane, click Add.
- Right-click the new bookmark and select Selected Visuals.
Technique 2. Implementing Bookmark Groups for Organization
Clean reports need clear names for bookmarks in power bi. Right-click multiple bookmarks and select Group to create a folder. Use a simple naming rule like “Toggle – Sales View” or “Nav – Finance.” This keeps things tidy as your Power BI navigation grows. Organized groups ensure your interactive dashboards remain manageable for other developers.
Technique 3. Using Selection Pane for Visibility Control
The selection pane acts like a layer manager for your visuals. Open it from the View tab. Toggle the “eye” icon to hide or show items, then right-click your bookmark and select Update. This creates a visual toggle effect without changing pages. It allows you to build pop-up menus or hide complex data until a user needs it.
Technique 4. Creating Visual Toggle Bookmarks
A visual toggle saves space on your screen by switching between dynamic visuals in the same spot.
- Place two visuals, like a table and a chart, directly on top of each other.
- Use the selection pane to hide the chart and show the table.
- Save this as “Table View” in bookmarks in power bi.
- Reverse the visibility and save as “Chart View.”
- Link these to Power BI buttons for the user to switch back and forth.
These basics set the stage for moving beyond simple clicks into deeper data control.
Technique 5. Implementing Navigation Buttons Linked to Bookmarks
Add Power BI buttons to your canvas to trigger bookmarks in power bi. This builds a clear path for users to move through reports. To set this up:
- Select a button or shape on your canvas.
- Go to the Format pane and turn on Action.
- Choose Bookmark as the type and select your target state.
Technique 6. Building Page Navigation Using Bookmarks
Use bookmarks in power bi to jump between different report pages while applying specific filters. While the bookmark navigator is a fast option, manual links offer more control over the user journey. It ensures your report structure stays consistent and user-friendly. Just ensure the Current Page setting is checked in the bookmark options to enable the jump.
Technique 7. Creating Presentation Mode with Bookmark View
Turn your report into a data storytelling tool using presentation mode. This is one of the top bookmark best practices for executive briefings where you need to show dynamic visuals in a specific order.
- Open the Bookmarks pane.
- Arrange your bookmarks in the desired sequence.
- Click the View button at the bottom of the pane to start the slideshow.
Moving from navigation to data handling adds another layer of power to your reports.
B) Advanced Filtering and Data Manipulation Techniques
Managing data states with bookmarks in power bi allows you to deliver specific insights without cluttering your interactive dashboards. These techniques focus on how you capture and apply filters to improve report interactivity and ensure your users see the most relevant data.
Technique 8. Capturing Filter States in Bookmarks
To save specific slicer settings, you must use the Data property in bookmarks in power bi. This ensures that when a user returns to a view, their filters remain exactly as you set them. This is essential for maintaining consistency in Power BI navigation.
- Set your slicers and filters to the desired values on the canvas.
- Click Add in the Bookmarks pane.
- Right-click the bookmark and ensure the Data option is checked in the settings menu.
Technique 9. Creating Department-Specific Filtered Views
You can use bookmarks in power bi to build role-based interactive dashboards. Instead of making five different reports, create five bookmarks that filter the data for Sales, Finance, or HR. This keeps your Power BI navigation simple while providing tailored data for every department. Users just click a button to see the numbers relevant to their specific job, ensuring high levels of report interactivity.
Technique 10. Implementing Year, Quarter, Month Toggle Bookmarks
Time-based bookmarks in power bi let users switch between different date granularities instantly. This is more efficient than manual drilling through hierarchies and keeps your dynamic visuals responsive.
- Create three bookmarks: “Monthly,” “Quarterly,” and “Annual.”
- For each, adjust your date slicer or field parameter to the correct level.
- Update each bookmark while the Data setting is active to “freeze” these temporal views.
Technique 11. Building Cross-Filter Bookmark Combinations
Combine multiple filters into single bookmarks in power bi to highlight specific business scenarios. For example, you can create a “High Risk” bookmark that filters for low-margin products in underperforming regions. This type of data storytelling helps users find critical issues without manual searching through several slicers in your interactive dashboards.
Technique 12. Creating Reset and Default View Bookmarks
A “Reset” button is one of the most vital bookmark best practices. As users interact with your interactive dashboards, they often get lost in deep filters. Creating a way to return to the start is a mandatory part of Power BI navigation.
- Set all slicers to their default, unfiltered state.
- Create a bookmark named “Reset All” in the pane.
- Link this to a prominent Power BI button on your canvas to restore the original view.
These data-driven techniques ensure your users always see the right numbers at the right time.
C) Advanced Storytelling and User Experience Techniques
Using bookmarks in power bi for data storytelling transforms your report from a grid of charts into a narrative. These methods help you guide users through interactive dashboards so they find the most important insights without getting distracted by extra data.
Technique 13. Building Guided Data Narratives Through Bookmarks
Arrange your bookmarks in power bi in a logical sequence to tell a story. You can lead a user from a high-level overview to a specific problem area. This structure ensures your interactive dashboards provide a clear path to action.
It is better than leaving users to explore dynamic visuals on their own. By controlling the flow of information, you improve report interactivity and keep the audience engaged.
Technique 14. Implementing Help Screens with Bookmarks and Overlays
Create a help layer to explain your dashboard to new users. Use bookmarks in power bi to show a semi-transparent shape with text instructions that point to key metrics. This improves the user experience by providing on-demand training directly within your Power BI navigation.
- Insert a shape that covers the report and set its transparency to 20%.
- Add text boxes on top of the shape to explain visuals or Power BI buttons.
- Group these items and save a bookmark with the group visible.
Technique 15. Using Bookmarks for Before-After Comparisons
Use a visual toggle to show the difference between two data states, like “Actuals” versus “Budget.” This is one of the best bookmark best practices for financial reporting. By placing two identical charts in the same spot and switching visibility, you make performance gaps easy to see in your interactive dashboards. This technique allows for rapid comparison without cluttering the screen with multiple pages.
Technique 16. Creating Tabbed Navigation Experiences
The bookmark navigator builds a tab-style interface at the top of your page. This makes your Power BI navigation feel like a modern website. It is much cleaner than using multiple Power BI buttons scattered across the canvas.
- Go to the Insert tab and select Buttons.
- Choose Navigator and then Bookmark navigator.
- Select the specific bookmark groups you want to display as tabs.
Technique 17. Building Spotlight Bookmarks for Emphasis
Use the spotlight feature to highlight one visual while dimming the others. This is perfect for presentation mode when you want the audience to focus on a single trend. It effectively draws the eye to critical data points within your dynamic visuals.
- Select a visual on your canvas.
- Click the three dots (…) and select Spotlight.
- Save this state as a new bookmark in your Power BI navigation flow.
Mastering these visual flows leads naturally to the technical side of keeping your reports fast and easy to update.
D) Advanced Technical and Optimization Techniques
Advanced developers use bookmarks in power bi to build scalable systems. These methods ensure your interactive dashboards remain fast and easy to update as your data grows. Focusing on technical discipline prevents your Power BI navigation from breaking during future updates.
Technique 18. Implementing Bookmark Groups with IDs for Developer Coordination
When multiple people work on a report, use ID suffixes for bookmarks in power bi and visual groups. For example, use “NAV_01” for a navigation button and “GRP_01” for its target visuals.
This naming convention makes it clear which elements connect to each other. It prevents errors when changing Power BI navigation paths or updating dynamic visuals.
Technique 19. Using Placeholder Groups for Scalable Bookmark Architecture
Future-proof your interactive dashboards by using placeholder groups. Even if you only have one chart, put it in a group before saving your bookmarks in power bi.
- Create a group containing your current visual.
- Link your bookmark to this group using the “Selected Visuals” setting.
- Add new visuals to this same group later without re-recording the bookmark.
Technique 20. Combining Bookmarks with Drill-Through for Deep Analysis
Combine bookmarks in power bi with drill-through actions to create a multi-level exploration experience. Use a bookmark to set a high-level summary view, then allow users to drill into details.
This is one of the most effective bookmark best practices for handling complex datasets. It keeps your main interactive dashboards clean while providing a path to granular data.
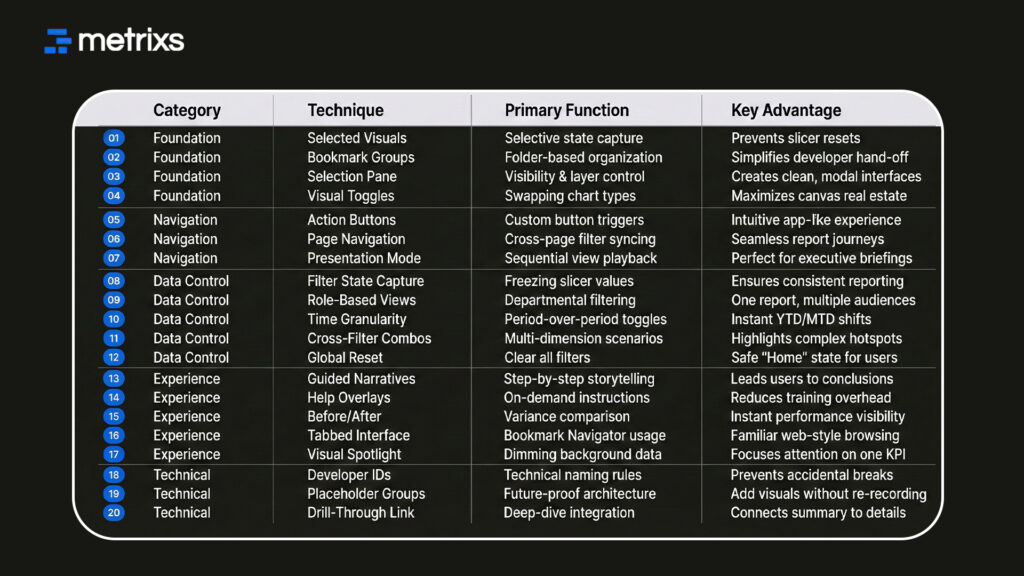
The Power BI Bookmark Mastery Matrix:
How Metrixs Helps You Create Interactive Power BI Dashboards
Metrixs delivers advanced analytics for Microsoft Dynamics 365 Finance & Operations. We turn raw ERP data into interactive dashboards that give a unified view of your finance and inventory performance. Using bookmarks in power bi, we help you organize 1,000+ metrics into clear stories.
Our team ensures your Power BI navigation stays efficient through:
- Rapid Integration: We complete your setup in under six weeks to minimize disruption.
- On-Demand Snapshots: Use bookmarks in power bi to capture historical trends and workforce shifts instantly.
- Multi-Region Flexibility: We track multiple currencies across global locations for consistent reporting.
- Automated Oversight: Reduce manual work by automating financial summaries and real-time dynamic visuals.
Metrixs turn your ERP into a growth engine with 80% faster reporting. We ensure your report interactivity stays high so you can scale efficiently → Metrixs
Conclusion
Bookmarks in power bi turn static rows into narratives. Yet, many teams struggle with messy Power BI navigation and broken links. Reports that fail to respond drive users away quickly.
You risk losing credibility when leaders cannot find answers during high-stakes meetings. Static dashboards cause missed opportunities and endless hours of manual fixing.
Metrixs build interactive dashboards that remain stable even as your data scales. Our team sets up bookmarks in power bi to stay reliable. We provide the architecture needed for reports that work every time. You get fast results without the technical debt.
Reach out to Metrixs to see how we build reliable interactive dashboards that stay fast with advanced bookmarks in power bi.
FAQs
1. What are the key differences between report bookmarks and personal bookmarks in Power BI?
Report bookmarks in power bi are built by developers for everyone, ensuring consistent Power BI navigation. Personal bookmarks let individuals save custom filters for private use. Both improve report interactivity by letting users return to specific views within their interactive dashboards quickly.
2. How do you scale bookmark implementation without creating architectural complexity?
Use bookmark groups and “Selected Visuals” to manage specific elements. This keeps your interactive dashboards organized and prevents Power BI navigation from breaking. Following bookmark best practices, like clear naming conventions, ensures your dynamic visuals remain easy to update as data grows.
3. What’s the recommended approach for creating bookmarks that capture filter states?
To capture data states, ensure the “Data” property is active in your bookmarks in power bi. This “freezes” slicer selections, which is vital for data storytelling. It allows your interactive dashboards to show specific regional or departmental insights through seamless Power BI navigation.
4. How do you use bookmarks for storytelling and guiding audiences through data narratives?
Use presentation mode to play bookmarks in power bi like a slideshow. This guides users through dynamic visuals in a logical order. Arranging your Power BI navigation this way improves report interactivity and ensures your data storytelling leads to clear business actions.
5. What are best practices for linking bookmarks to buttons and shapes?
Assign bookmarks in power bi to Power BI buttons via the “Action” menu. This makes your interactive dashboards feel like an app. Use a bookmark navigator for tab-style Power BI navigation, providing a clean interface for users to explore different report views.
6. How do you combine bookmarks with drill-through functionality?
Link bookmarks in power bi to a summary view, then use drill-through to reach granular data. This creates a multi-layered experience in your interactive dashboards. It balances high-level dynamic visuals with deep analysis, making your Power BI navigation more powerful for analysts.

