

Financial planning fails when you ignore the gaps. Most CFOs now use software. Yet many still miss the story behind the numbers. You fly blind when you run a business without variance analysis.
You need to see how your financial performance stacks up. Variance analysis goes beyond missing a target. It helps you find the reason why. This guide helps you fix your budget variance issues. You will learn to compare budget vs actual results. Stop guessing. Metrixs help you use your data to drive results.
Understanding the Fundamentals of Budget vs. Actual Analysis
You cannot manage what you do not measure. This section breaks down the core concepts you need to master to stay on track.
Variance analysis is the math behind your business reality. It measures the gap between your financial planning goals and what actually happened. You use variance interpretation to guide your next move.
Here are the core pillars for your financial performance:
- The Baseline: Compare your budget vs actual numbers to see where you stand.
- Favorable variance: This happens when you make more money or spend less than expected.
- Unfavorable variance: This means you missed a goal or spent too much.
- The Context: An expense variance might look favorable if you did not hire a key staff member, but it hurts you later.
- The Big Picture: A revenue variance might be down because you stopped selling a bad product.
Good FP&A teams use variance analysis to find the “why” behind every budget variance. Metrixs help you spot these trends without manual work. Variance analysis shows you the truth.
Now that you know the basics, let’s look at the math.
A Step-by-Step Framework for Calculating Variance
Math is the backbone of variance analysis. You need a clear process to turn raw data into insights. Follow these steps to calculate your budget variance accurately and understand your financial performance.
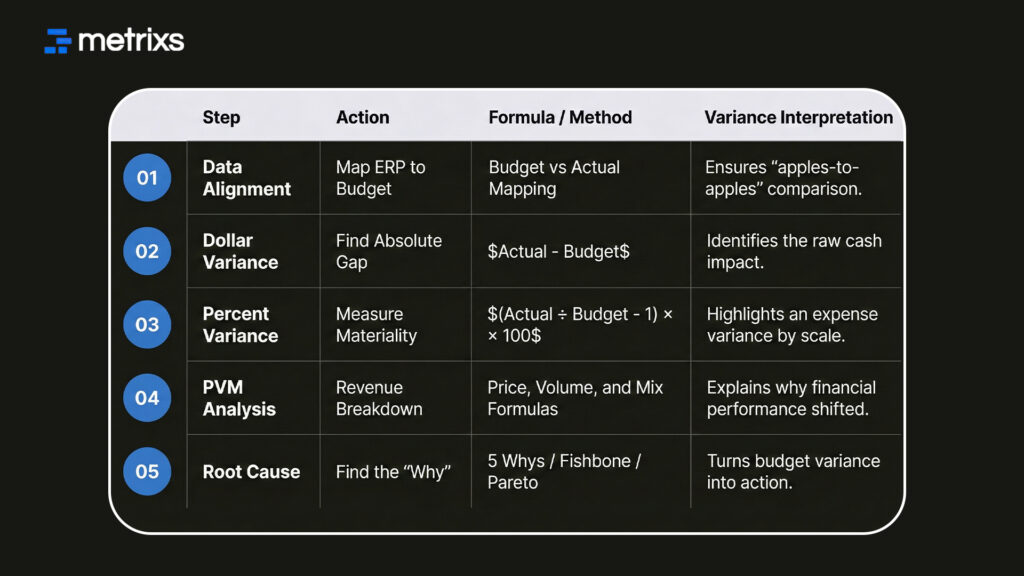
Step 1 – Data Alignment:
Start by cleaning your data. You must compare “apples to apples.” Ensure your actual line items from your ERP match your financial planning categories. If they don’t, your budget vs actual report will be wrong. Check that your time periods and accounting methods are identical across both datasets to avoid “phantom” errors.
Step 2 – Dollar Variance Calculation:
Find the absolute difference. This step is the core of variance analysis.
Use this formula: Actual – Budget = Variance.

This shows you the raw impact on your cash flow. A positive result is a favorable variance for revenue because you earned more. For expenses, a positive number is an unfavorable variance because you spent more than you planned.
Step 3 – Percentage Variance:
Dollars don’t tell the full story. You need to see the impact relative to the size of the line item.
Use this formula: (Actual / Budget – 1) * 100 = % Variance.

This helps you find a significant expense variance that needs your attention. A $10,000$ miss on a million-dollar budget is small, but on a $20,000$ budget, it is a crisis.
Step 4 – Price-Volume-Mix(PVM) Decomposition:
Break down your revenue variance. You need to know if you sold more items or just raised prices. This is where FP&A adds the most value.
- Price Effect: Calculate how much your pricing strategy changes affected the total. (Actual Price – Budgeted Price) * Actual Volume.
- Volume Effect: See how many more or fewer units you actually sold compared to the plan. (Actual Volume – Budgeted Volume) * Budgeted Price.
- Mix Effect: Determine if you sold more of your high-margin products or low-margin ones.
Step 5 – Root Cause Analysis:
Do not stop at the numbers. Use a root cause analysis to find out why the gap exists. Was it a one-time fluke or a market shift? Metrixs automates this step of your financial planning so you can spend your time fixing problems instead of finding them.
Quick Reference: Variance Calculation Framework
Calculating the numbers is just the start of the job. You now have the data to find the real issues affecting your business.
Identifying the Root Cause of Financial Discrepancies
Finding a gap in your budget vs actual report is only the beginning. To fix the issue, you must identify why the numbers shifted. A deep variance interpretation allows you to move from reacting to problems to solving them.
Use these proven methods to conduct a thorough root cause analysis.
A) The 5 Whys Technique
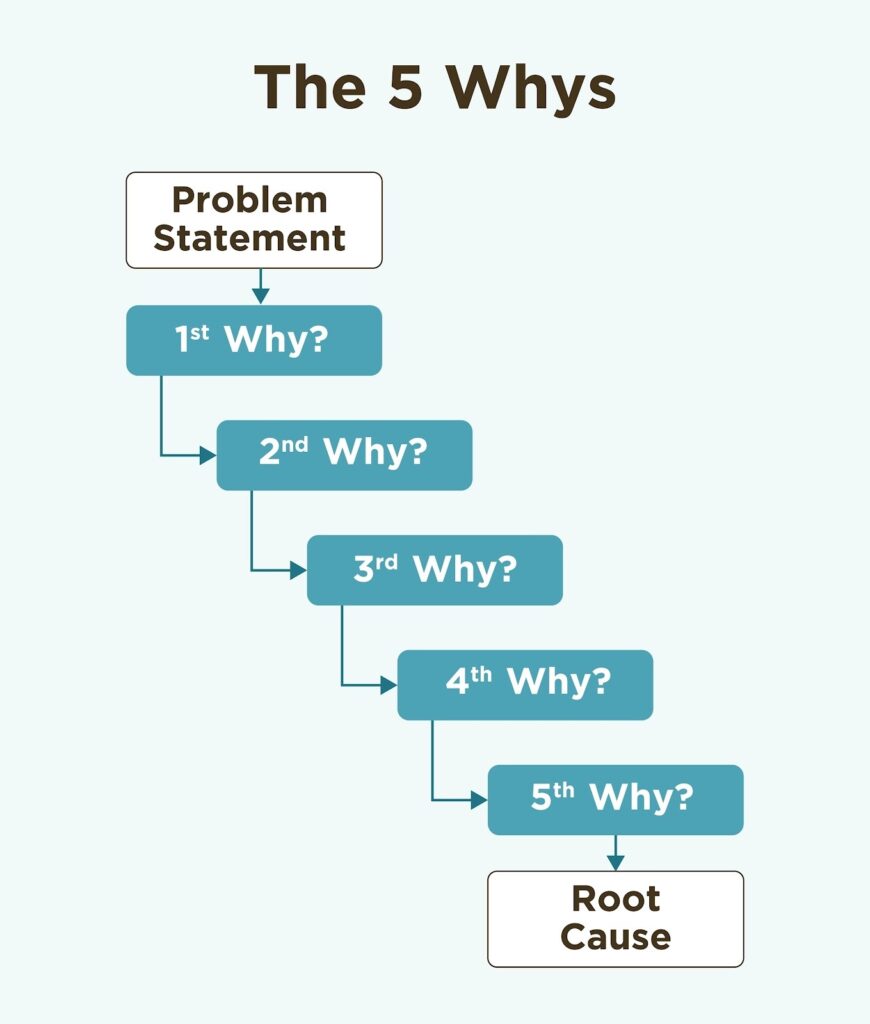
This method helps you look past the surface of an unfavorable variance. You simply ask “why” until you reach the source of the problem.
If your variance analysis shows a drop in sales:
- Why? Customer orders fell this month.
- Why? A major competitor dropped their prices.
- Why? They reduced their production costs through automation.
- Why? Our current manual process is too expensive.
- Why? We have not updated our ERP workflow in three years.
B) Fishbone (Ishikawa) Diagrams
Sometimes the cause isn’t a single event. A fishbone diagram helps you categorize potential issues into groups like people, processes, or external market shifts. This prevents “tunnel vision” during your financial planning reviews. You might find that a labor expense variance is actually caused by a flawed training process rather than a staff shortage.
C) Pareto Analysis (80/20 Rule)
Efficiency matters in FP&A. Usually, 20% of your line items cause 80% of your total budget variance. Focus your energy on these high-impact areas first. By setting a specific threshold for variance analysis, such as investigating any gap over 5%, you ensure your team spends time where it counts most.
Identifying the source of the trouble is half the battle. Next, we will see how the right tools make this process even faster.
How Metrixs Optimizes Variance Analysis for Microsoft Dynamics 365
Metrixs turn your ERP into a powerful growth engine. It automates variance analysis by pulling data directly from Microsoft Dynamics 365, ensuring 99.9% accuracy. You can stop wrestling with spreadsheets and start improving your financial performance with these features:
- Fast Reporting: Build budget vs actual reports 80% faster with 1,000+ metrics.
- Global View: Track multiple currencies easily to keep your financial planning consistent across all regions.
- Smart Snapshots: Capture real-time trends to fix an unfavorable variance before it grows.
- Quick Setup: Start your automated budget variance journey in under six weeks.
With Metrixs, your data becomes a clear map for future success. Stop fighting your data and start using it to grow, explore how Metrixs simplifies your variance analysis today.
Conclusion
Effective variance analysis is the difference between leading a market and falling behind. Many finance teams still manually track every budget variance, wasting hours on spreadsheets that hide more than they reveal.
If you rely on broken data, the consequences are severe: you might slash budgets for high-growth projects or miss a massive expense variance until it is too late to fix. These errors lead to wasted capital and lost trust with stakeholders. You cannot afford to guess your financial performance.
Metrixs solves this by automating your budget vs actual workflows within Dynamics 365. It provides the clarity needed to turn financial planning into a competitive advantage without the manual headache.
Ready to turn your data into a clear roadmap for growth? Schedule a demo with Metrixs today and simplify your variance analysis forever.
Frequently Asked Questions
1. Why is variance analysis important in financial planning?
It validates your assumptions and shows exactly where your business needs to pivot. Without variance analysis, you cannot determine if your financial performance is due to strategy or luck. It helps you find the “why” behind every budget variance to stay profitable.
2. How does Microsoft Dynamics 365 handle budget variances?
D365 stores your raw data, but it lacks the deep variance interpretation layers found in Metrixs. Using an analytics tool ensures your budget vs actual reports stay real-time and actionable, turning your ERP data into a primary driver for financial planning.
3. What is a materiality threshold?
This is a set dollar amount or percentage that determines which unfavorable variance is large enough to investigate. It keeps your FP&A team focused on the 20% of issues that drive 80% of your results, ensuring efficient variance analysis every month.
4. Can I automate Price-Volume-Mix analysis?
Yes. Metrixs performs these complex FP&A calculations automatically within your financial planning workflow. You can instantly see if revenue shifts come from pricing changes or sales volume, eliminating the manual errors common in traditional budget vs actual spreadsheets.
5. How do you fix a recurring unfavorable variance?
You must use root cause analysis to find the systemic issue. Whether it is an expense variance in labor or a shift in market demand, identifying the source allows you to adjust your financial planning and stop the leak permanently.

