

Microsoft Dynamics NAV is a powerhouse for transaction processing, but users often call it a “data jail.” Information flows in easily, yet extracting it in a readable format often requires a developer or mastery of “CTRL+C / CTRL+V” into Excel. While modern competitors leverage AI-driven dashboards, many Microsoft Dynamics NAV users still run static reports that are outdated the moment you print them.
You don’t necessarily need a costly migration to Business Central to fix this right now. This guide breaks down the native reporting architecture and explores how business intelligence integration modernizes your decision-making without replacing your core ERP. We will help you turn your raw numbers into actionable insights today.
Exploring the Native NAV Reporting Toolkit
You must understand the built-in capabilities first. Microsoft Dynamics NAV includes several native mechanisms to extract data, varying significantly in flexibility.
1. Account Schedules
Dynamics NAV account schedules allow you to build custom P&L and balance sheets directly in the interface. This tool handles financial statement formatting without external help. However, Microsoft Dynamics NAV restricts this to General Ledger data, preventing detailed inventory tracking.
2. Dimensions and Data Slicing
NAV dimension analysis solves data clutter. Instead of creating endless GL accounts, you use tags like “Department” or “Region.” Microsoft Dynamics NAV lets you “slice” a single revenue entry by multiple criteria instantly for better operational visibility.
3. RDLC Reports
Standard documents like invoices use the RDLC report designer. These dynamic NAV reporting tools are rigid. Changing a simple logo often requires C/AL coding for reports, forcing you to rely on developers.
For flexible insights, you usually need business intelligence integration rather than these static forms. These limitations drive many teams to look beyond the native tools and embrace modern business intelligence integration.
Integrating Modern Business Intelligence Tools
Data often needs to leave the system to become useful. Effective business intelligence integration bridges the gap between raw table data and strategic decision-making.
Quick Glance: Modern BI Tools for NAV
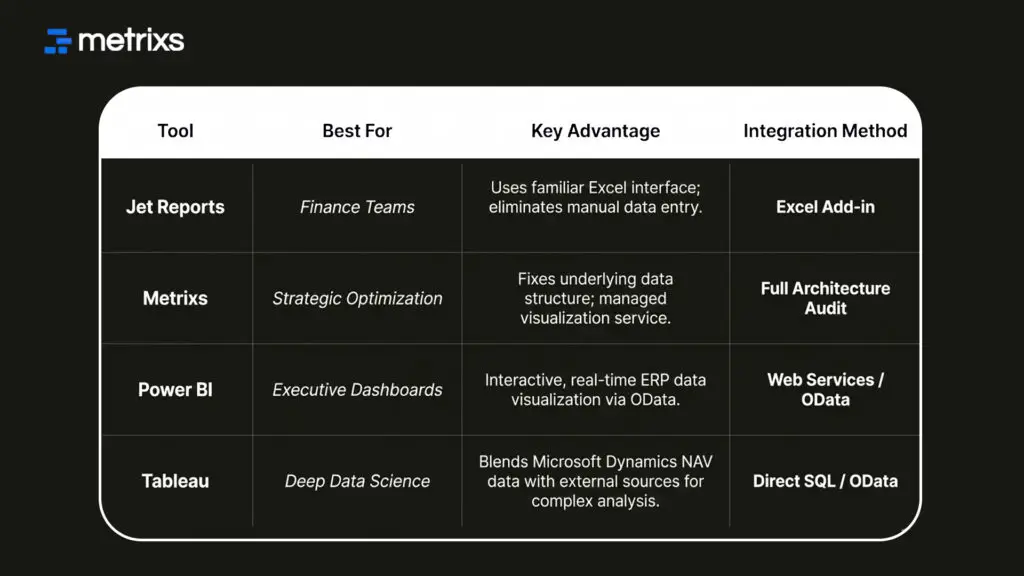
Here are four powerful tools that help you extract intelligence from Microsoft Dynamics NAV.
1. Jet Reports (The Excel Standard)
Excel remains the standard for finance teams. Jet Reports integration acts as a plugin directly inside Excel to pull live data from Microsoft Dynamics NAV. You use familiar formulas like “GL” and “NL” to retrieve balances instantly. It combines the stability of your ERP with the flexibility of spreadsheets, eliminating manual copy-paste errors.
2. Metrixs (Managed Reporting Optimization)
Software tools fail if the underlying data structure is messy. Metrixs optimizes your existing architecture first. We assess your Dynamics NAV account schedules and SQL indexes to remove bottlenecks. Then, we build the pipeline for ERP data visualization, ensuring you get automated dashboards today and a cleaner path to Business Central tomorrow.
3. Microsoft Power BI (The Native Visualizer)
Spreadsheets explain “what” happened, but charts explain “why.” Connecting Power BI for NAV via OData web services turns rows of grey numbers into colorful, interactive charts. This setup feeds live data into operational reporting dashboards. Executives can view on tablets, shifting the focus to real-time management without slowing down Microsoft Dynamics NAV.
4. Tableau (Advanced Visual Analytics)
If you need deep scientific analysis, Tableau is the heavy hitter. It connects via SQL to blend Microsoft Dynamics NAV data with unrelated external sources like market trends. Tableau offers superior customization for “pixel-perfect” dashboards that native dynamic nav reporting tools cannot match, though it requires a well-optimized SQL server to maintain performance.
Integrating these external tools solves visibility issues, but they can expose underlying database problems if you aren’t careful.
Troubleshooting Slow Report Performance
Nothing kills productivity like a frozen screen. If your Dynamics NAV reporting tools drag, specific architectural issues are usually to blame.
A) FlowFields Issues: Microsoft Dynamics NAV calculates fields like “Inventory Availability” on the fly using FlowFields. If you run broad reports on these fields without strict filtering, the system attempts to sum millions of entries instantly, crushing server speed.
B) Table Locking: Running heavy reports during peak hours locks database tables. If a report is reading the “Sales Line” table, your warehouse staff cannot post shipments until the report finishes.
C) The Fix: Schedule massiveSQL Server Reporting Services (SSRS) reports for off-hours using job queues. Alternatively, use a data warehouse approach. This offloads the strain, ensuring Microsoft Dynamics NAV remains fast for daily operations while you analyze trends elsewhere.
Solving these technical bottlenecks is just the first step toward transforming your entire reporting strategy.
How Metrixs Turns Legacy Data into Strategic ROI

Metrixs delivers advanced analytics and reporting insights specifically for Microsoft Dynamics NAV. It helps enterprises consolidate data seamlessly, transforming raw ERP numbers into a unified view of Microsoft Dynamics NAV performance across finance, inventory, and operations.
With a comprehensive library of 1,000+ metrics and 100+ pre-built reports, Metrixs enables 80% faster dynamic nav reporting tools usage and 99.9% data accuracy. It eliminates manual inconsistencies and siloed data, ensuring your ERP serves as a growth engine rather than just a data collector.
Our Key Strengths:
- Rapid Integration: Get up and running in under six weeks with a seamless Microsoft Dynamics NAV implementation that minimizes business disruption.
- On-Demand Data Snapshots: Instantly capture historical trends, workforce shifts, and inventory flows for proactive business intelligence integration.
- Multi-Region Flexibility: Effortlessly track multiple currencies and units of measurement to ensure consistent Microsoft Dynamics NAV reporting across global locations.
- Centralized Financial Oversight: Automate balance sheets and financial summaries to reduce manual work and maintain a real-time view of your data.
- Measurable Impact: Smart insights help reduce operational costs by 15% and optimize resource allocation within your Microsoft Dynamics NAV strategy.
Metrixs turn data into a competitive advantage, providing the clarity and speed businesses need to scale efficiently. Explore how Metrixs ensures you use your ERP to its full advantage and simplifies Microsoft Dynamics NAV.
Conclusion
Microsoft Dynamics NAV is a robust engine, but its native reporting often traps data behind a grey screen. You likely struggle with rigid layouts and slow dynamic nav reporting tools that require constant developer support.
This disconnect creates a dangerous blind spot. When you rely on manually compiled spreadsheets, you risk making decisions based on outdated numbers. A single copy-paste error can skew your financial outlook, leaving you reactive to market changes.
You don’t have to accept this risk. Metrixs transforms your legacy data into a modern asset. We optimize your architecture and enable seamless business intelligence integration, ensuring accurate insights today and a clear path for the future.
Don’t let your data gather dust. Contact Metrixs for a Reporting Health Check to see what insights are hiding in your ledgers.
FAQ
1. Can I use Power BI with older versions of Dynamics NAV?
You can connect Power BI for NAV typically from NAV 2013 onwards using OData web services. For older versions like Classic Client, you must connect via direct SQL. This requires careful handling of table relations to ensure your business intelligence integration remains accurate and secure.
2. What is the difference between account schedules and analysis views?
Dynamics NAV account schedules focus on formatting financial statements using only General Ledger data. In contrast, analysis views allow you to combine GL numbers with NAV dimension analysis. This lets you cross-reference operational data, like expenses by department, for deeper, multidimensional reporting insights.
3. Do I need a developer to change my invoice layout in NAV?
Generally, yes. Native RDLC report designer layouts are complex and separate the visual design from the dataset. While newer versions offer Word Layouts for minor text edits, substantial changes usually require C/AL coding for reports. Most users find business intelligence integration tools easier for customization.
5. Why do my native NAV reports run so slowly?
This often happens when you run reports on FlowFields (calculated fields) without proper indexing. It forces Microsoft Dynamics NAV to calculate every single entry on the fly. This heavy processing load freezes the system, making SQL Server Reporting Services (SSRS) a better option for heavy tasks.
6. Is Jet Reports better than native NAV reporting?
For flexible financial statements, yes. Jet Reports integration offers Excel flexibility that native RDLC cannot match. However, for strict transactional documents like checks or invoices, native Dynamics NAV reporting tools remain the standard. Jet Reports integration excels at ad hoc analysis rather than official document generation.

